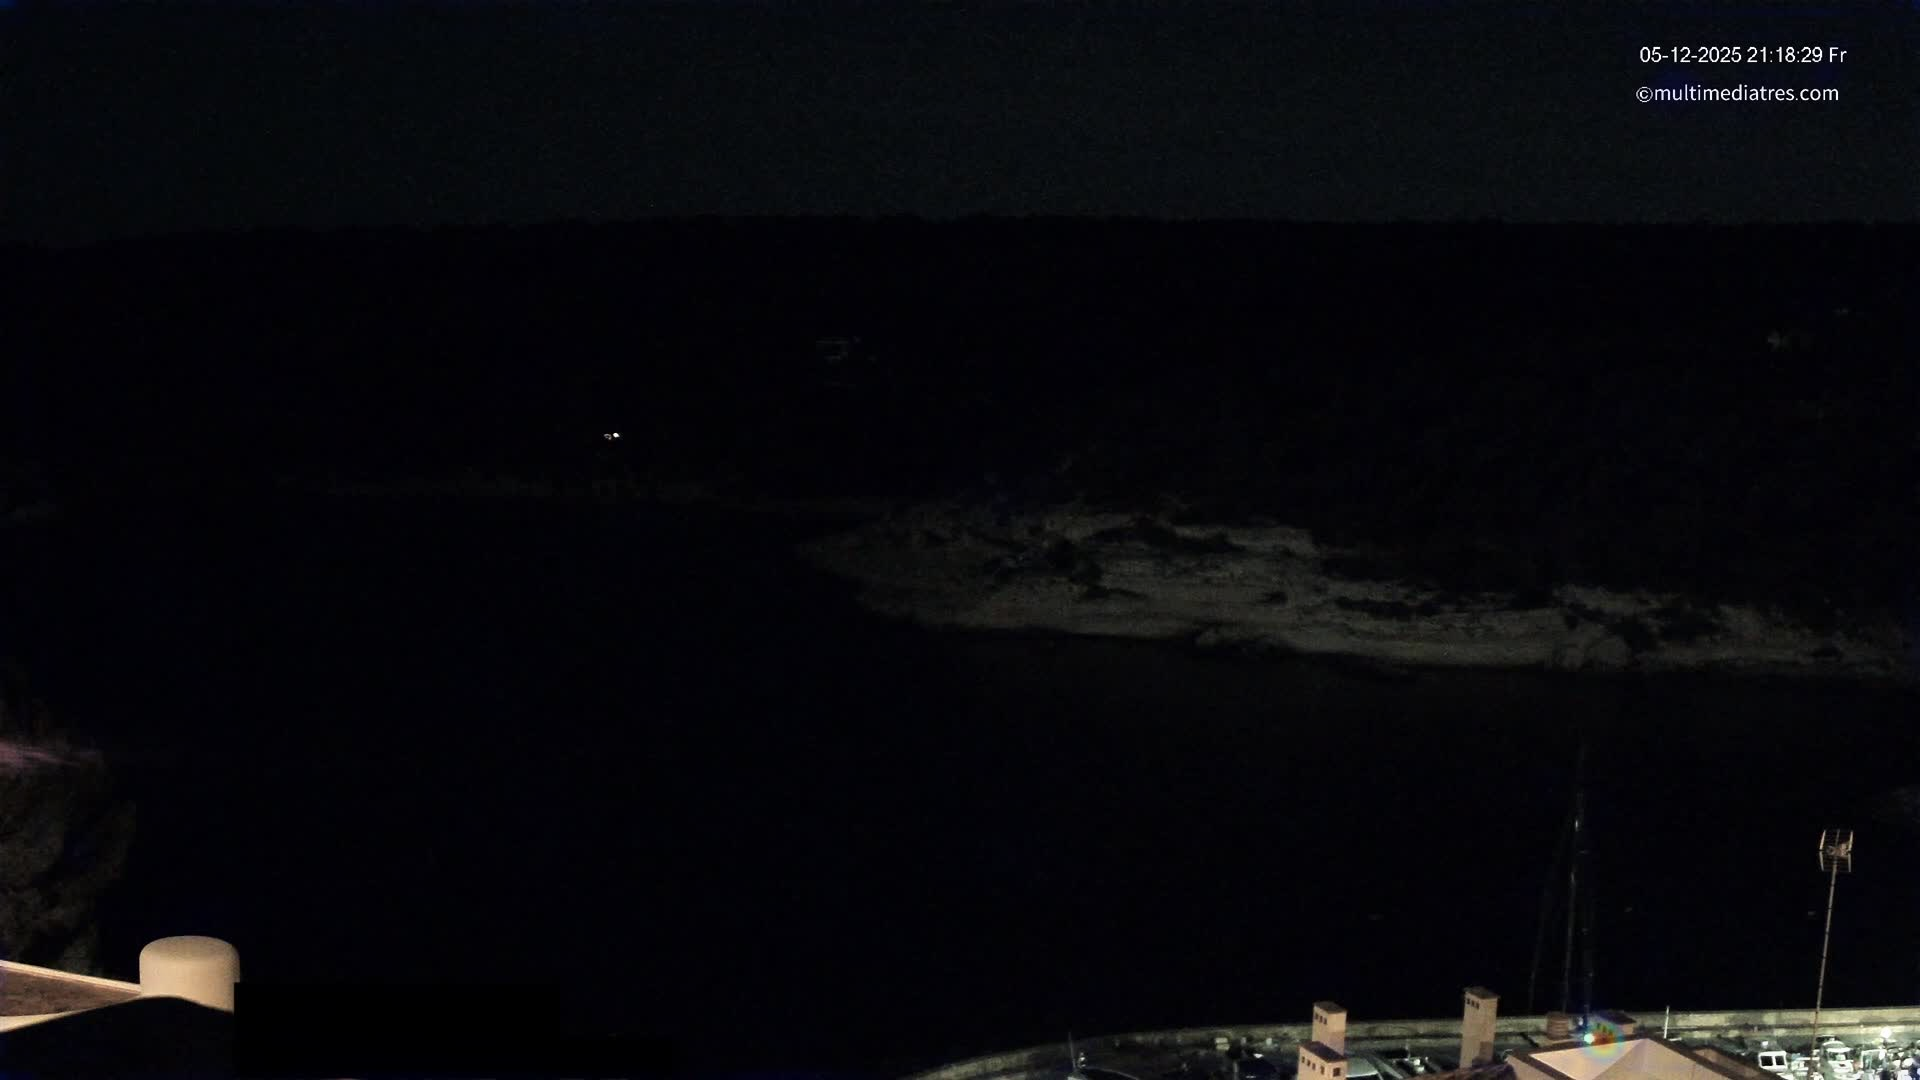
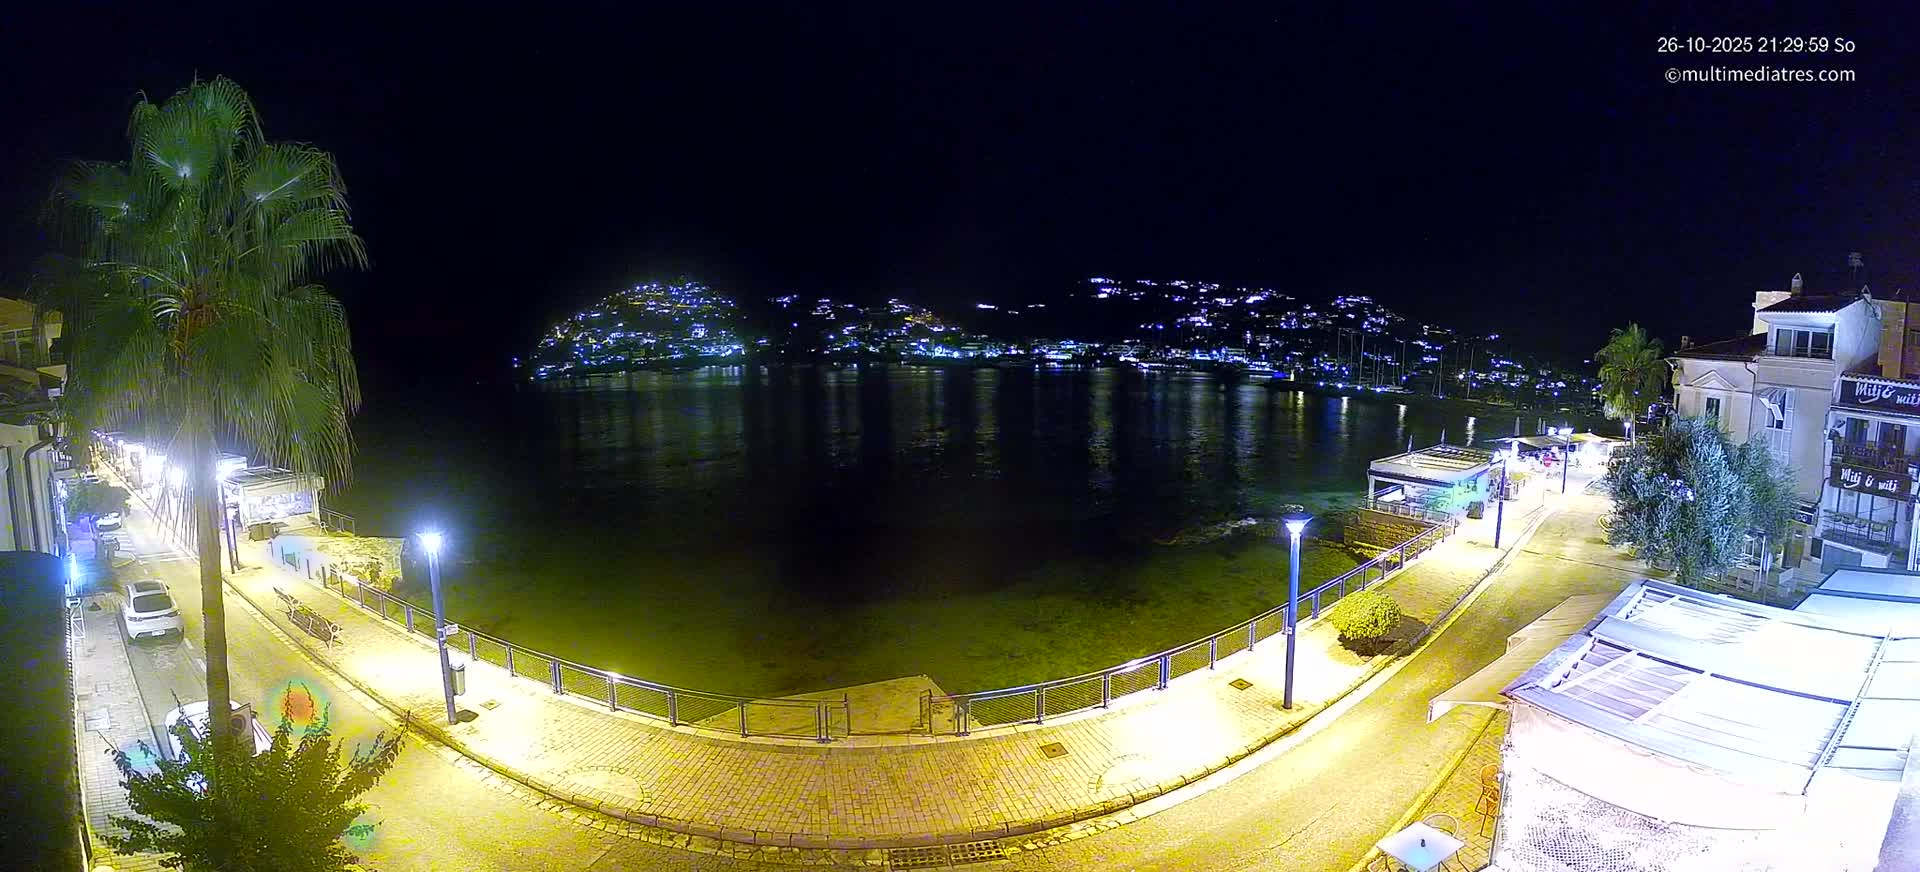
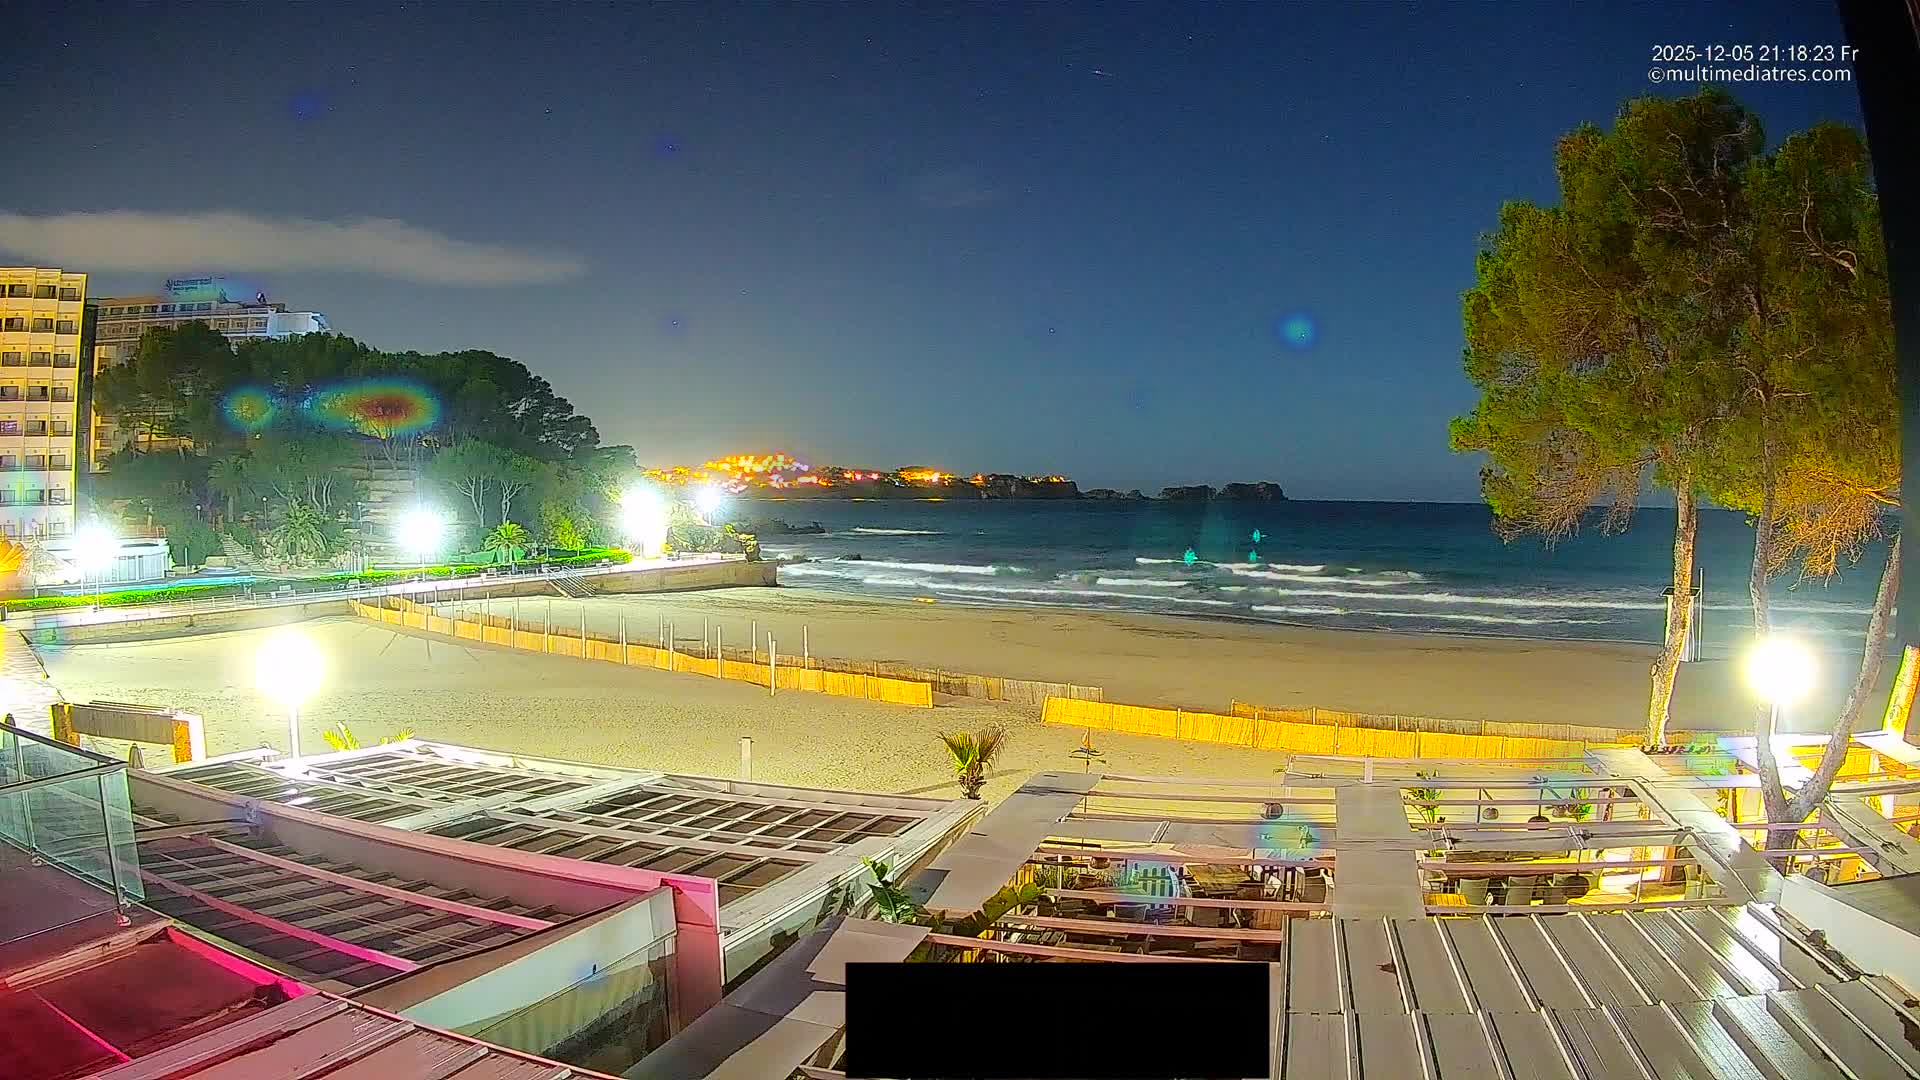
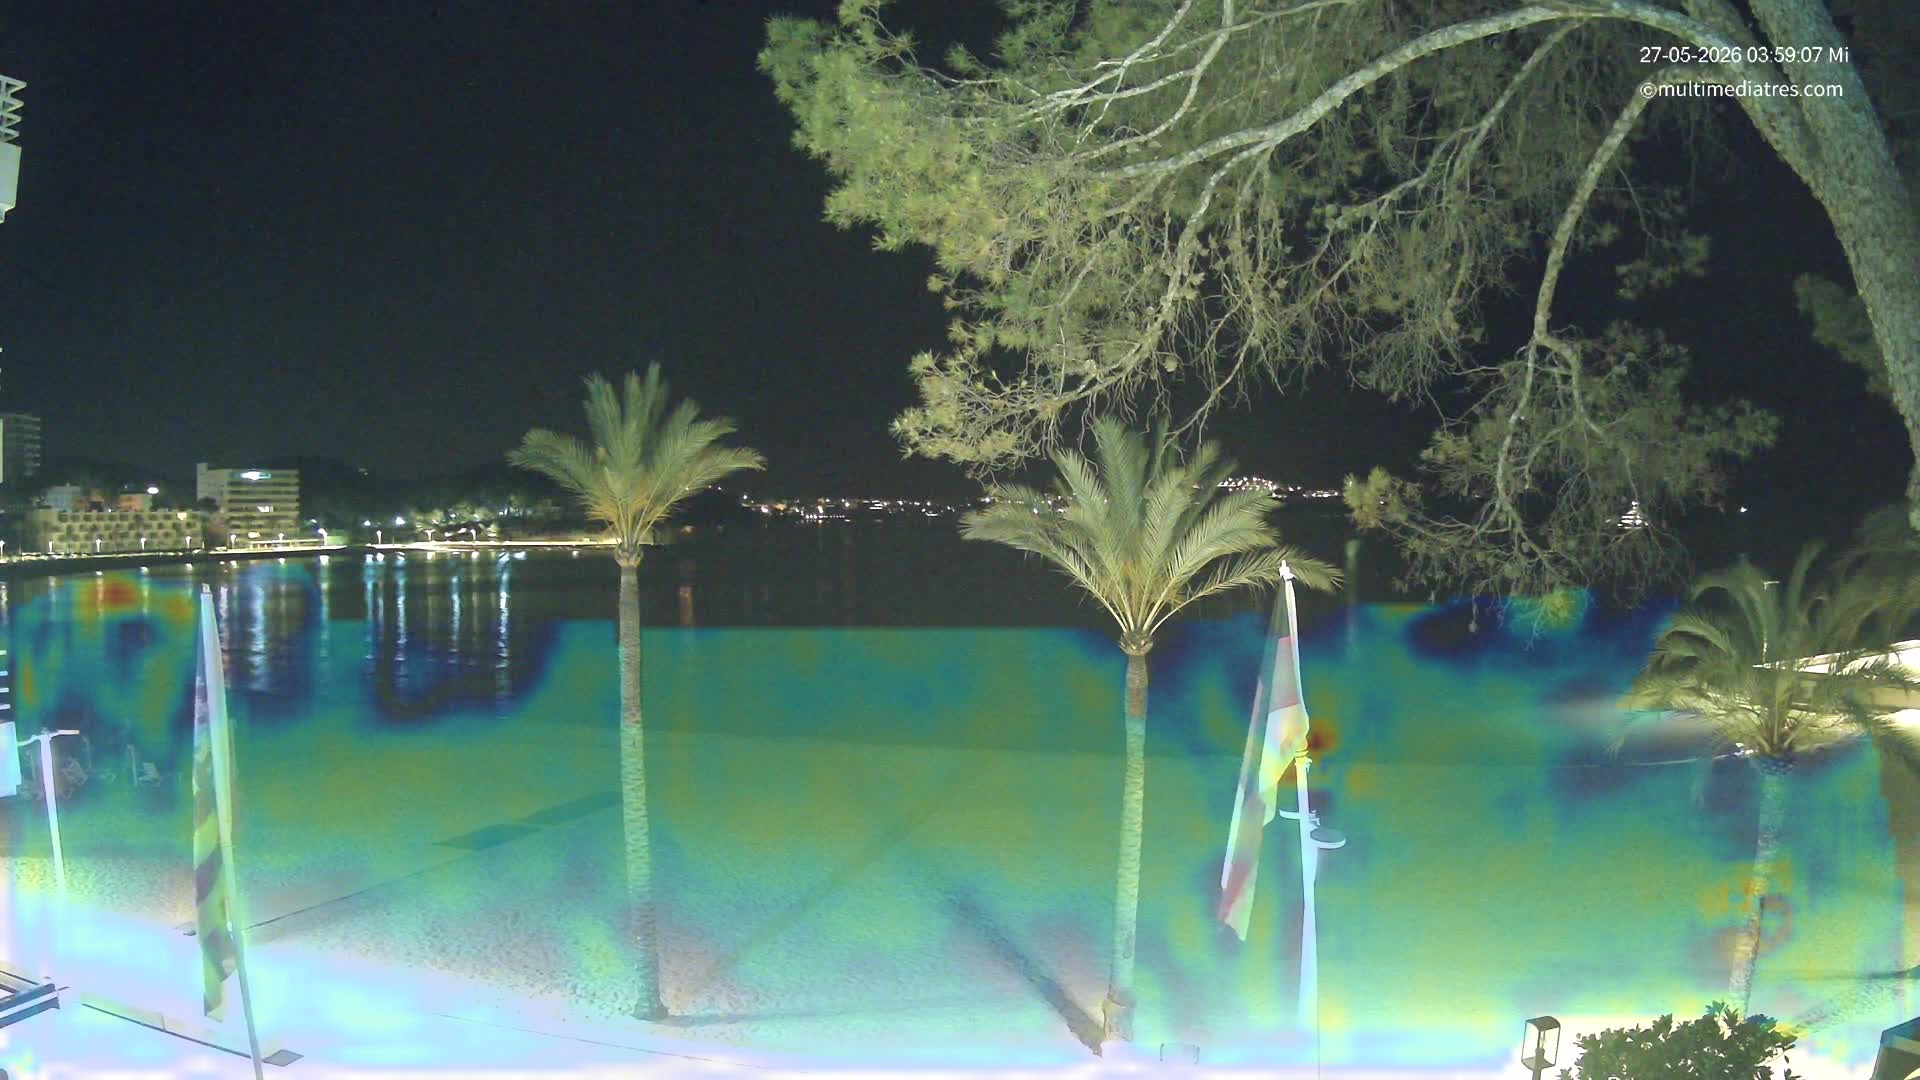
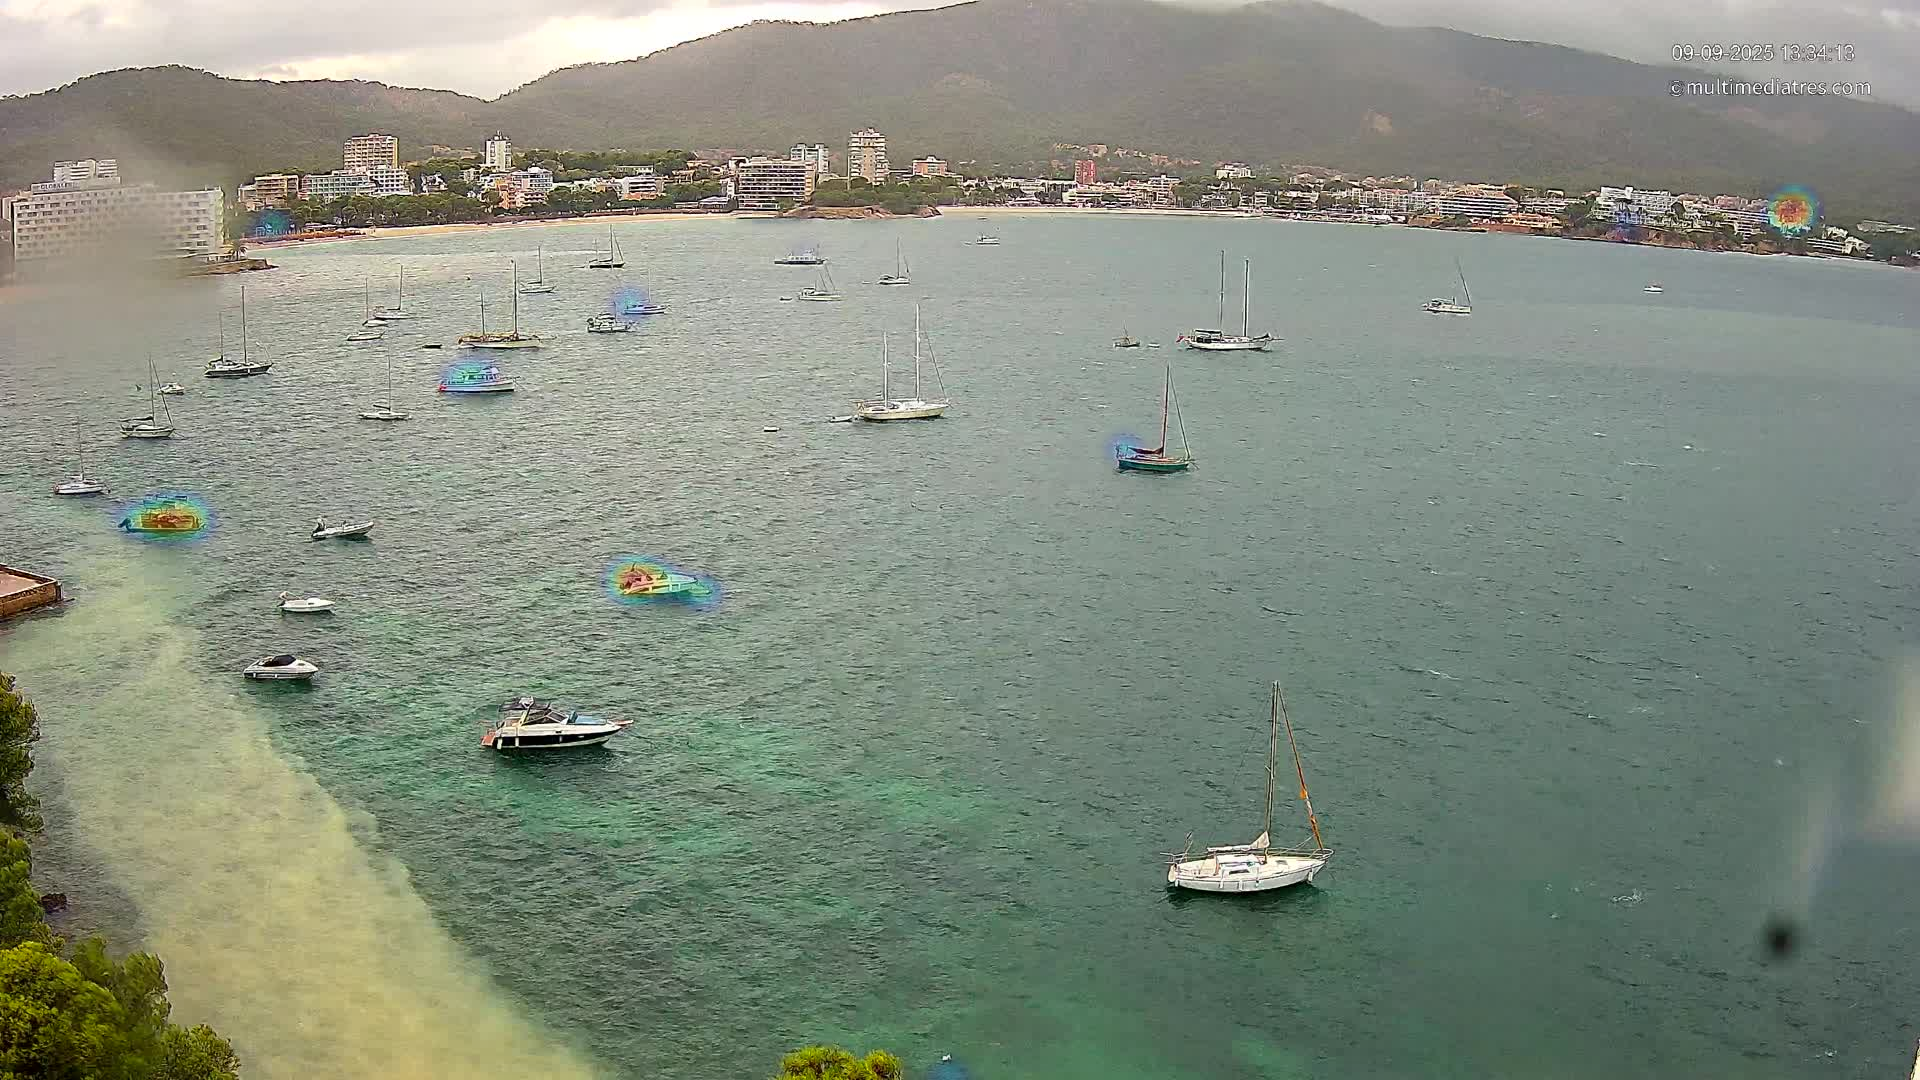
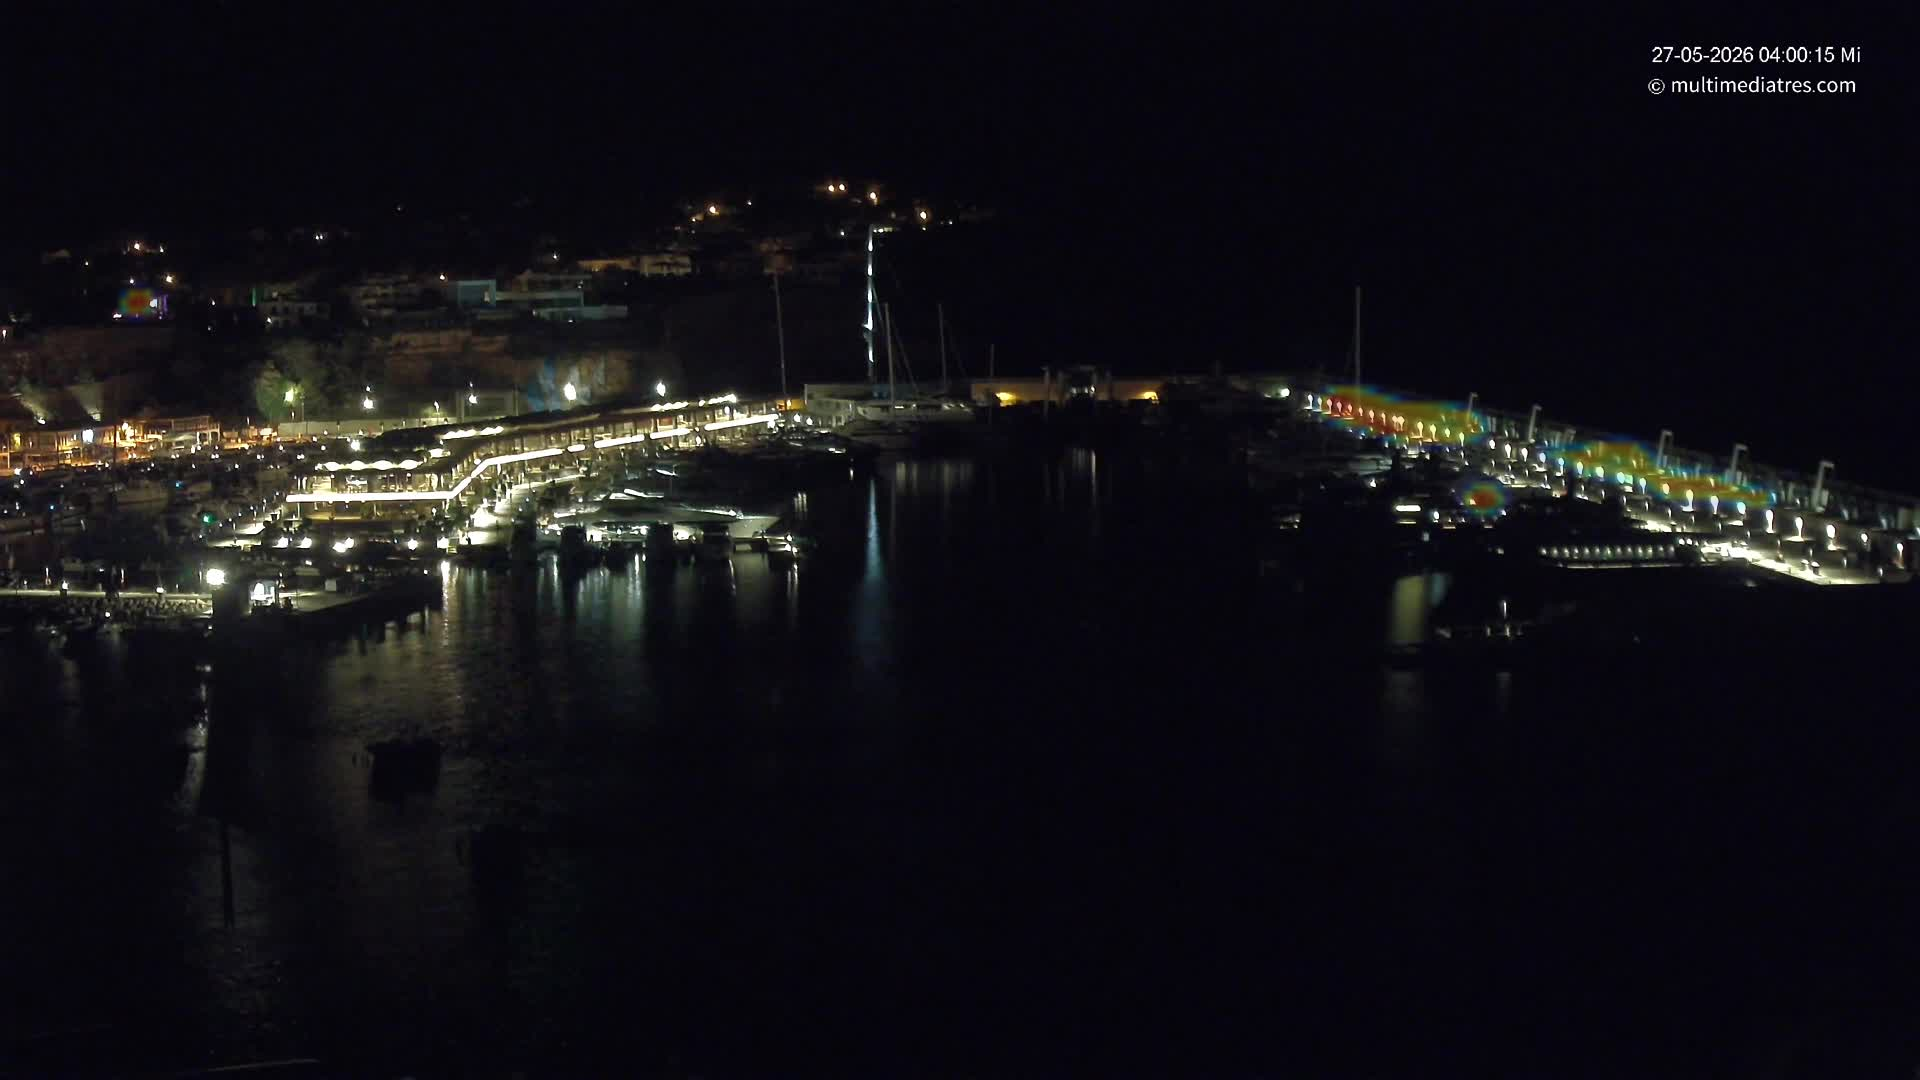
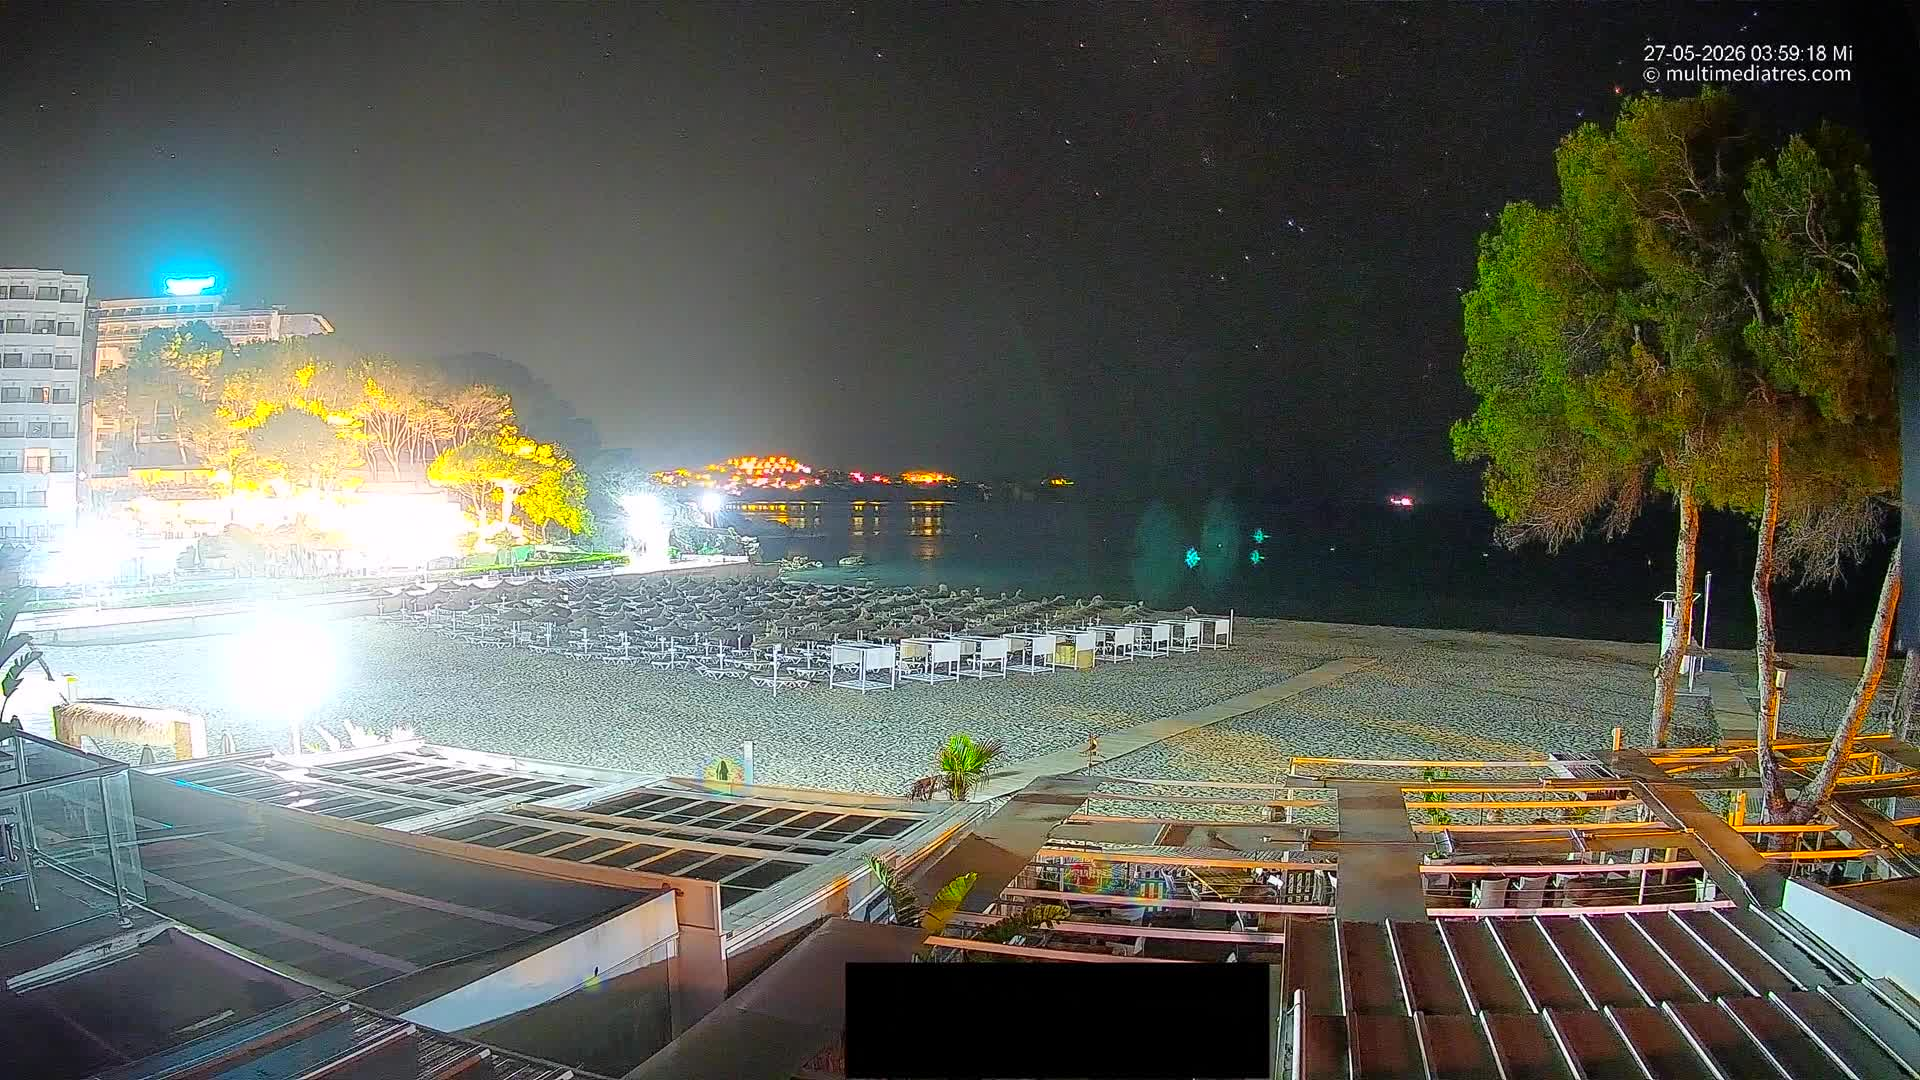
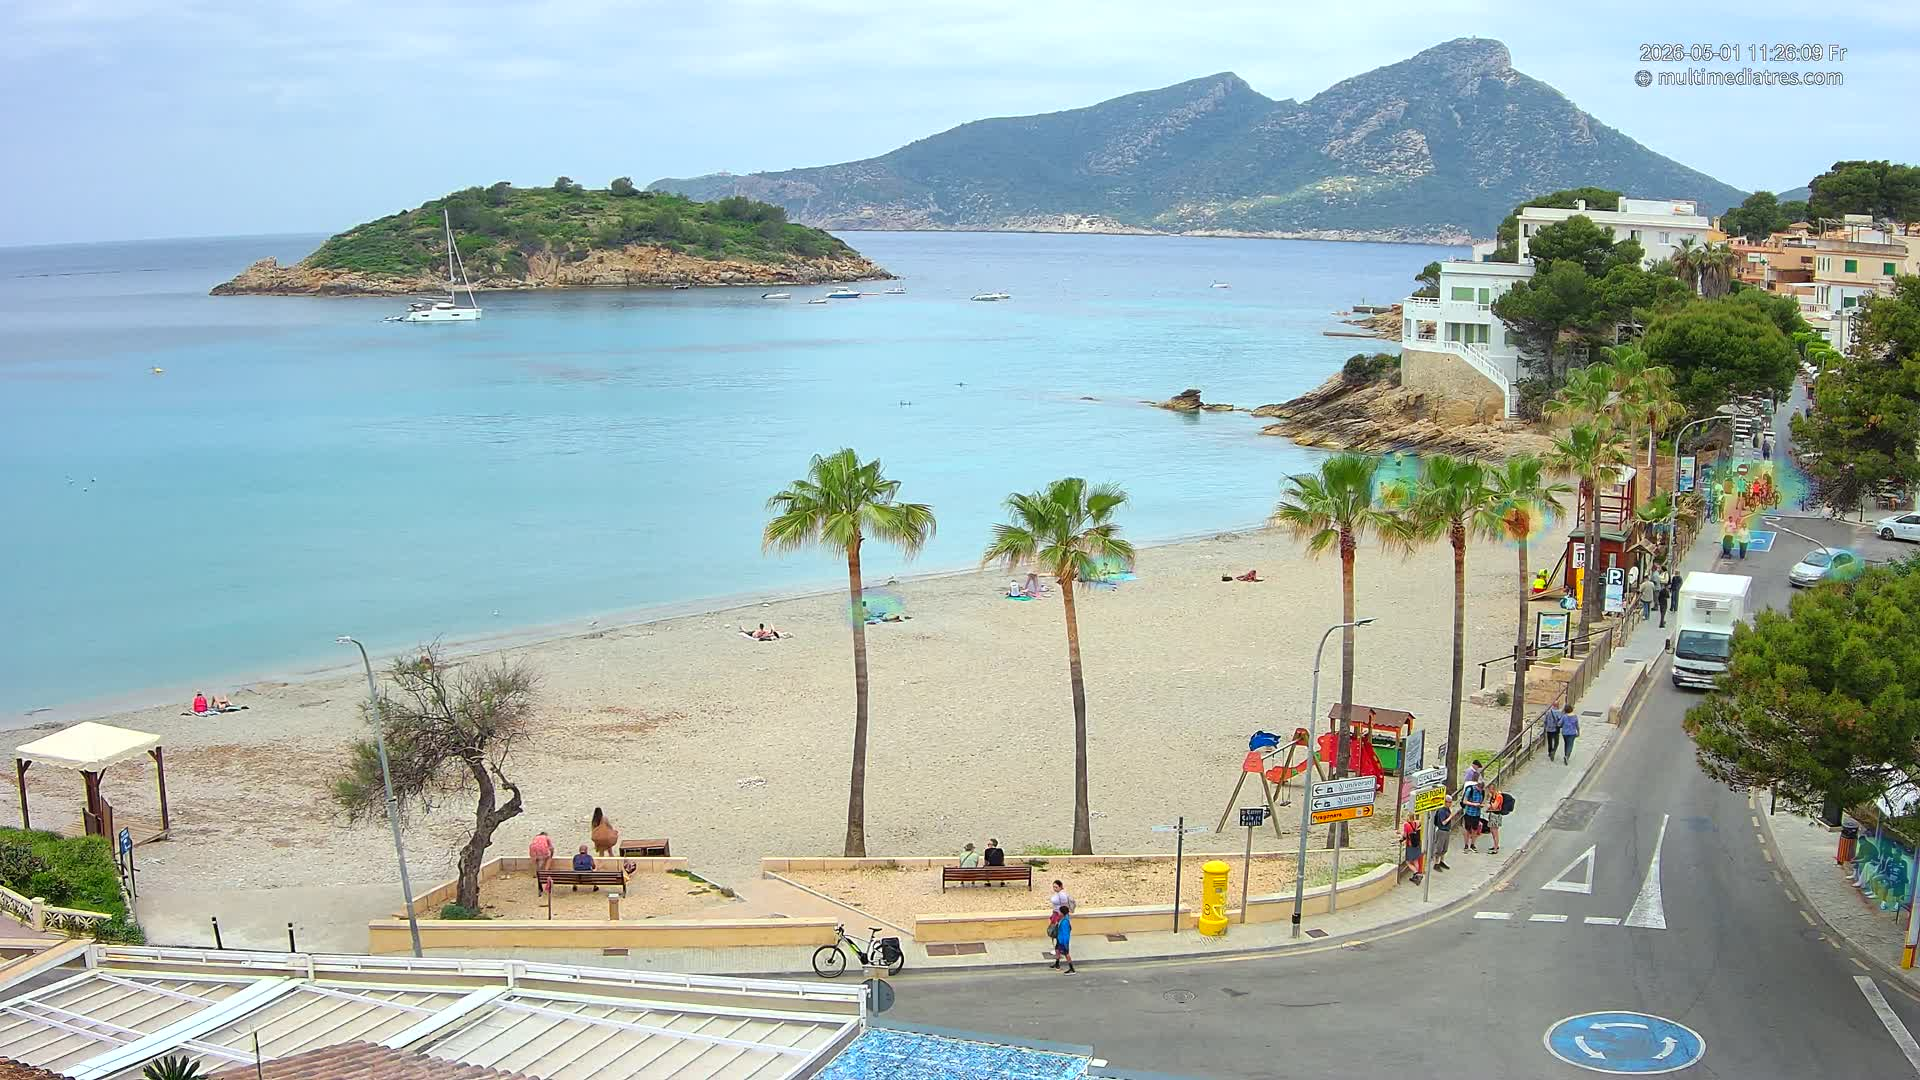
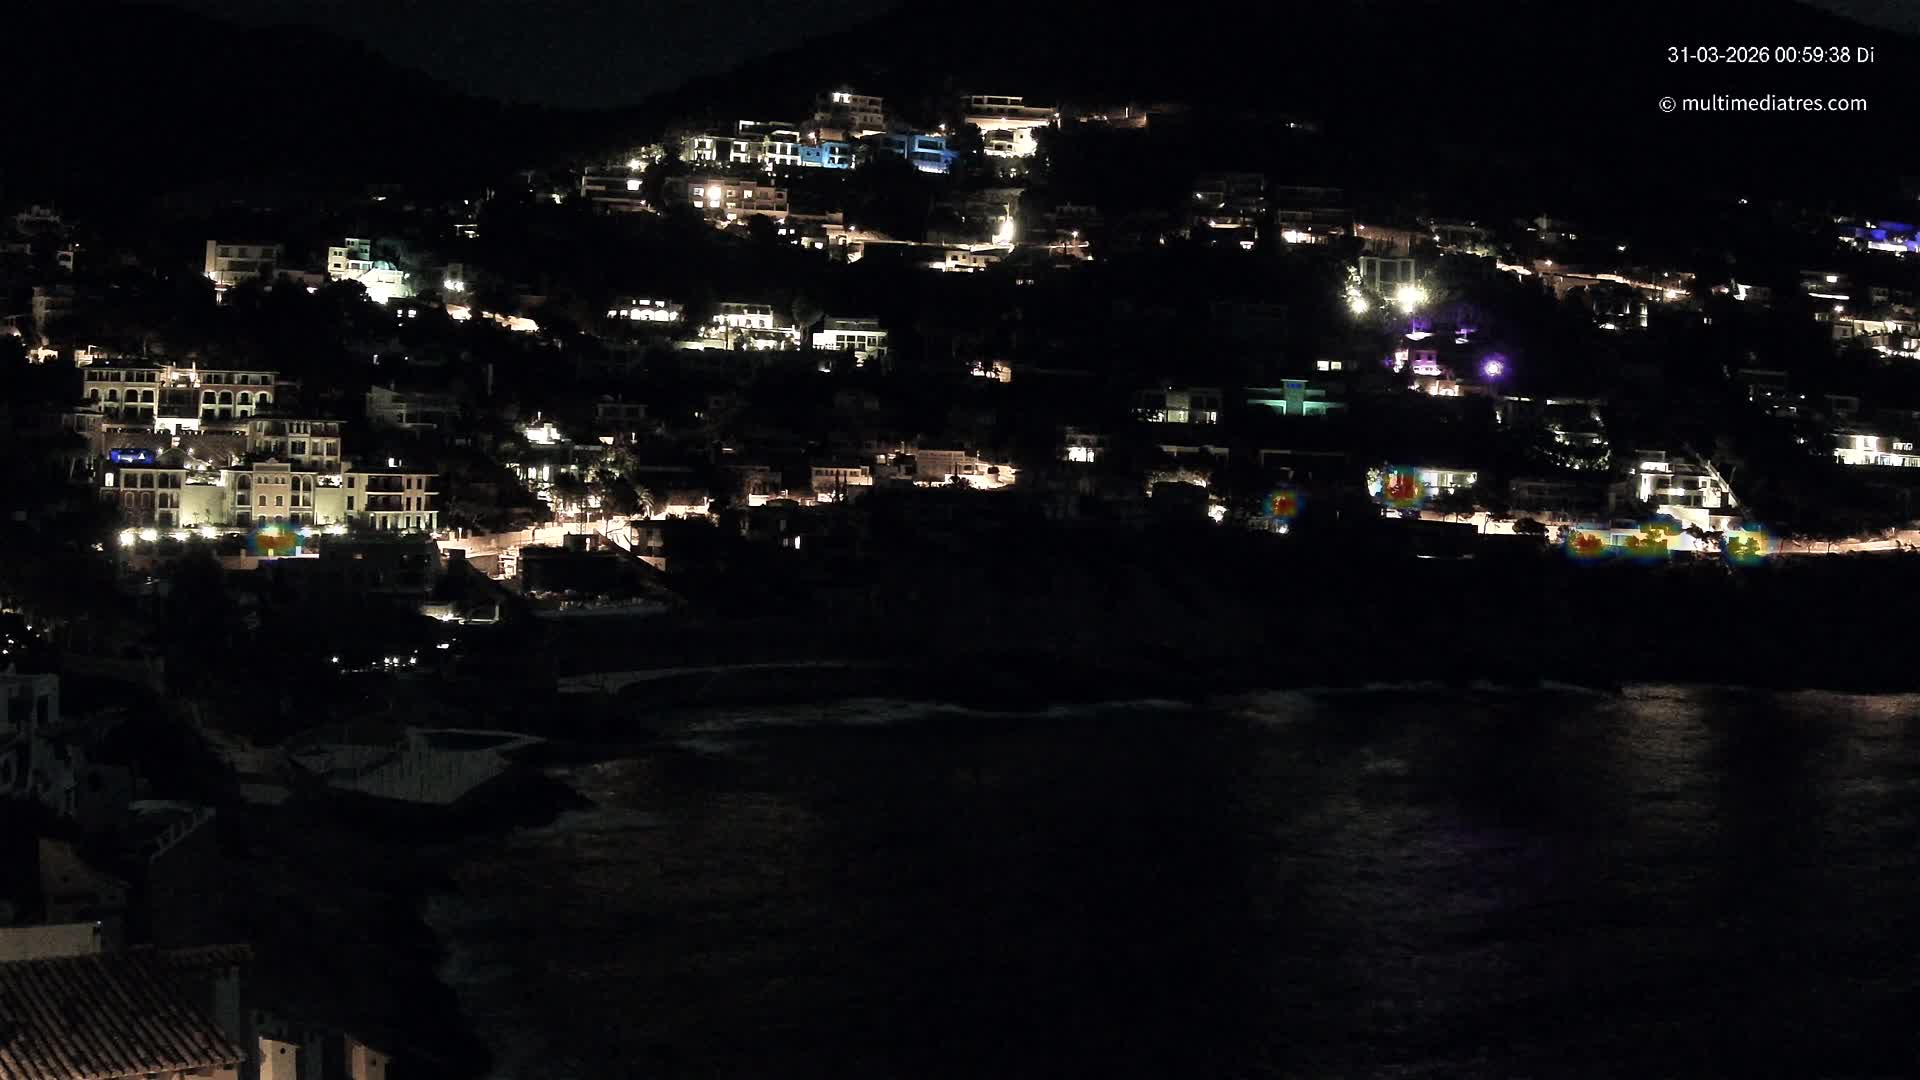
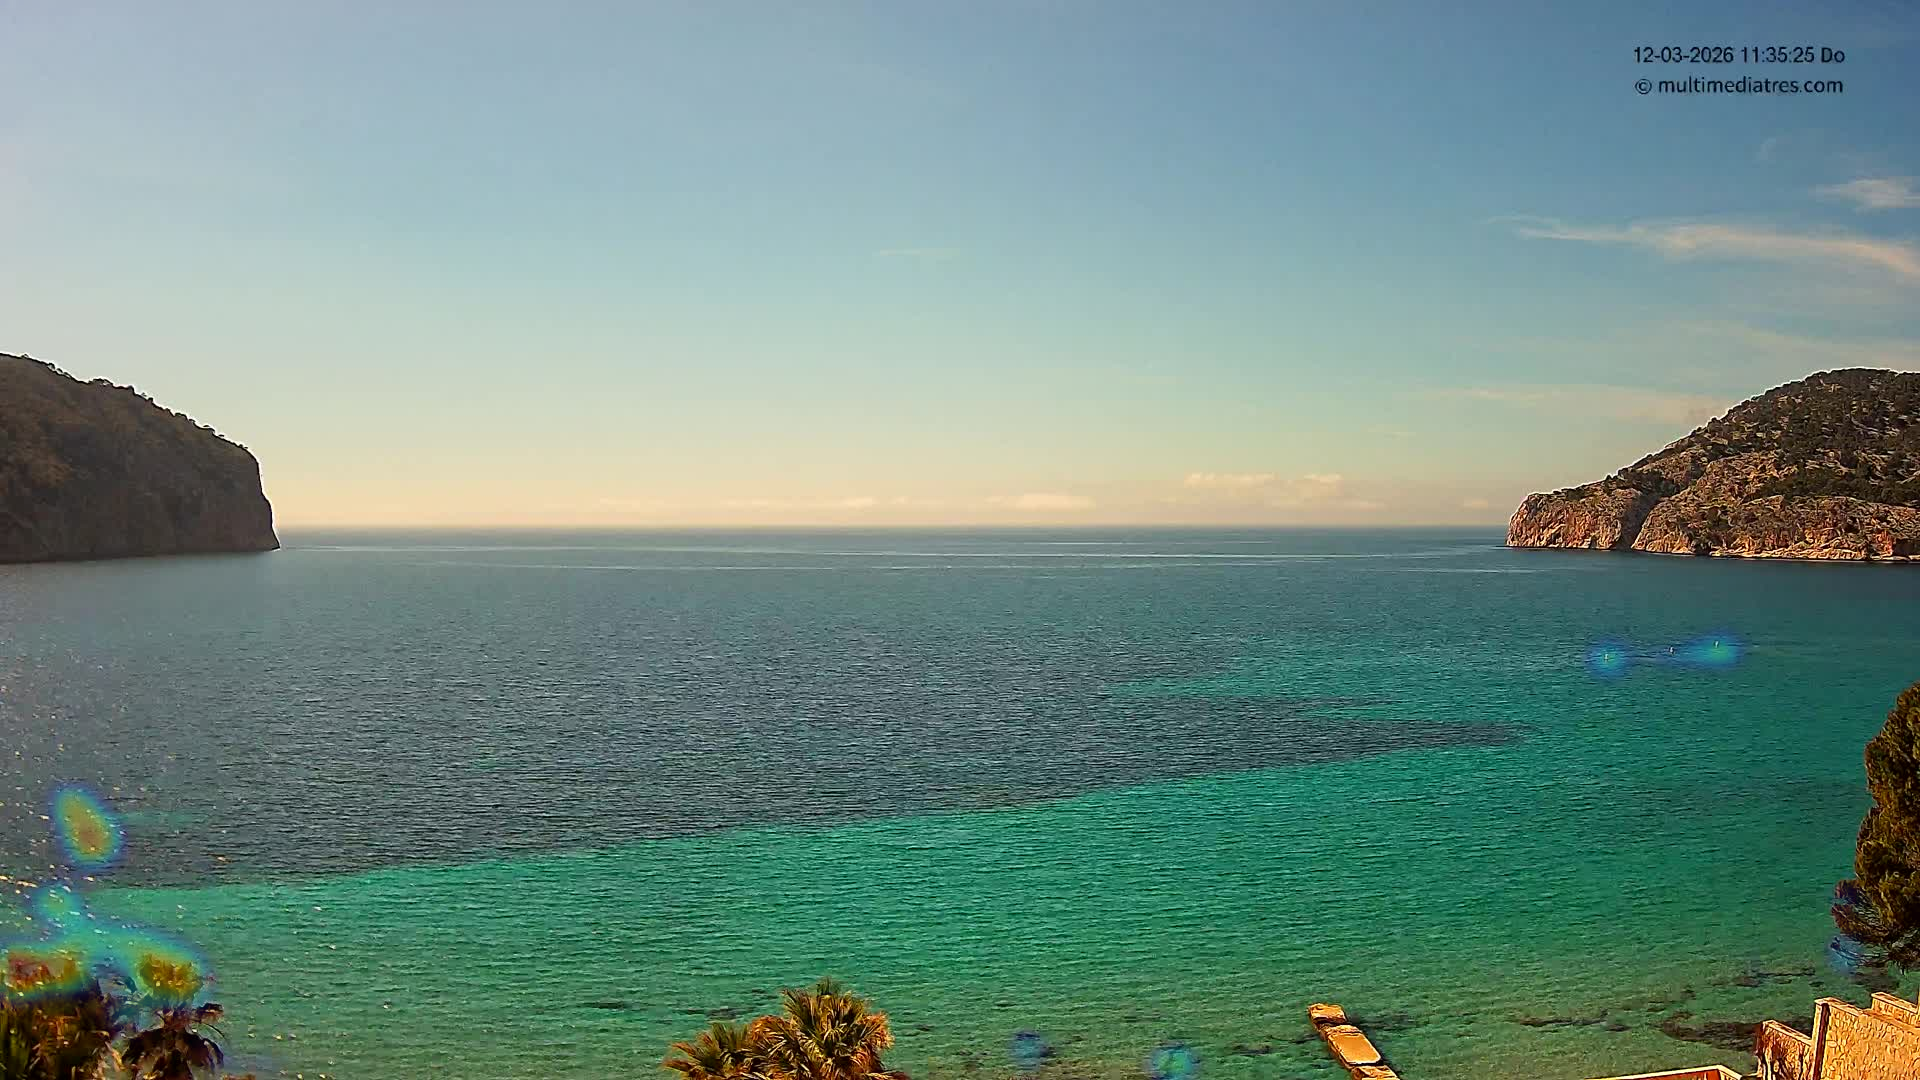
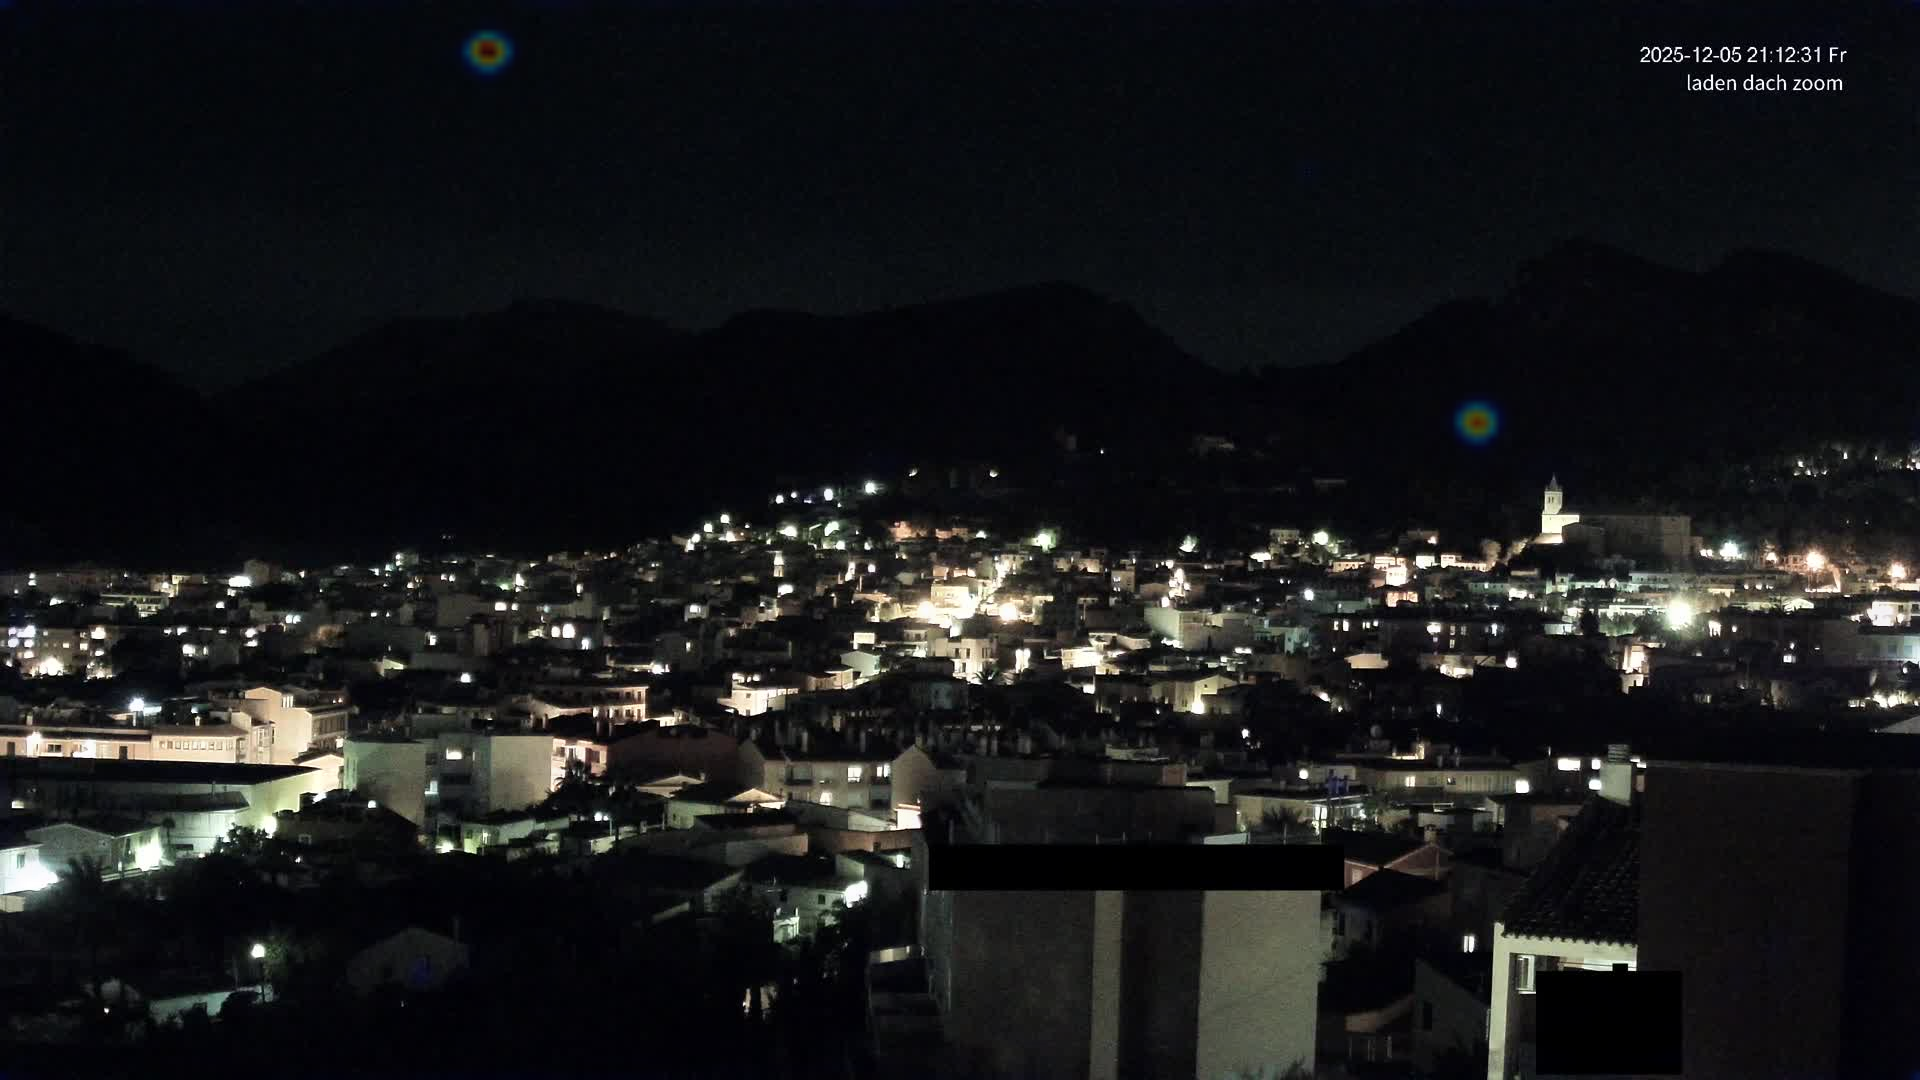
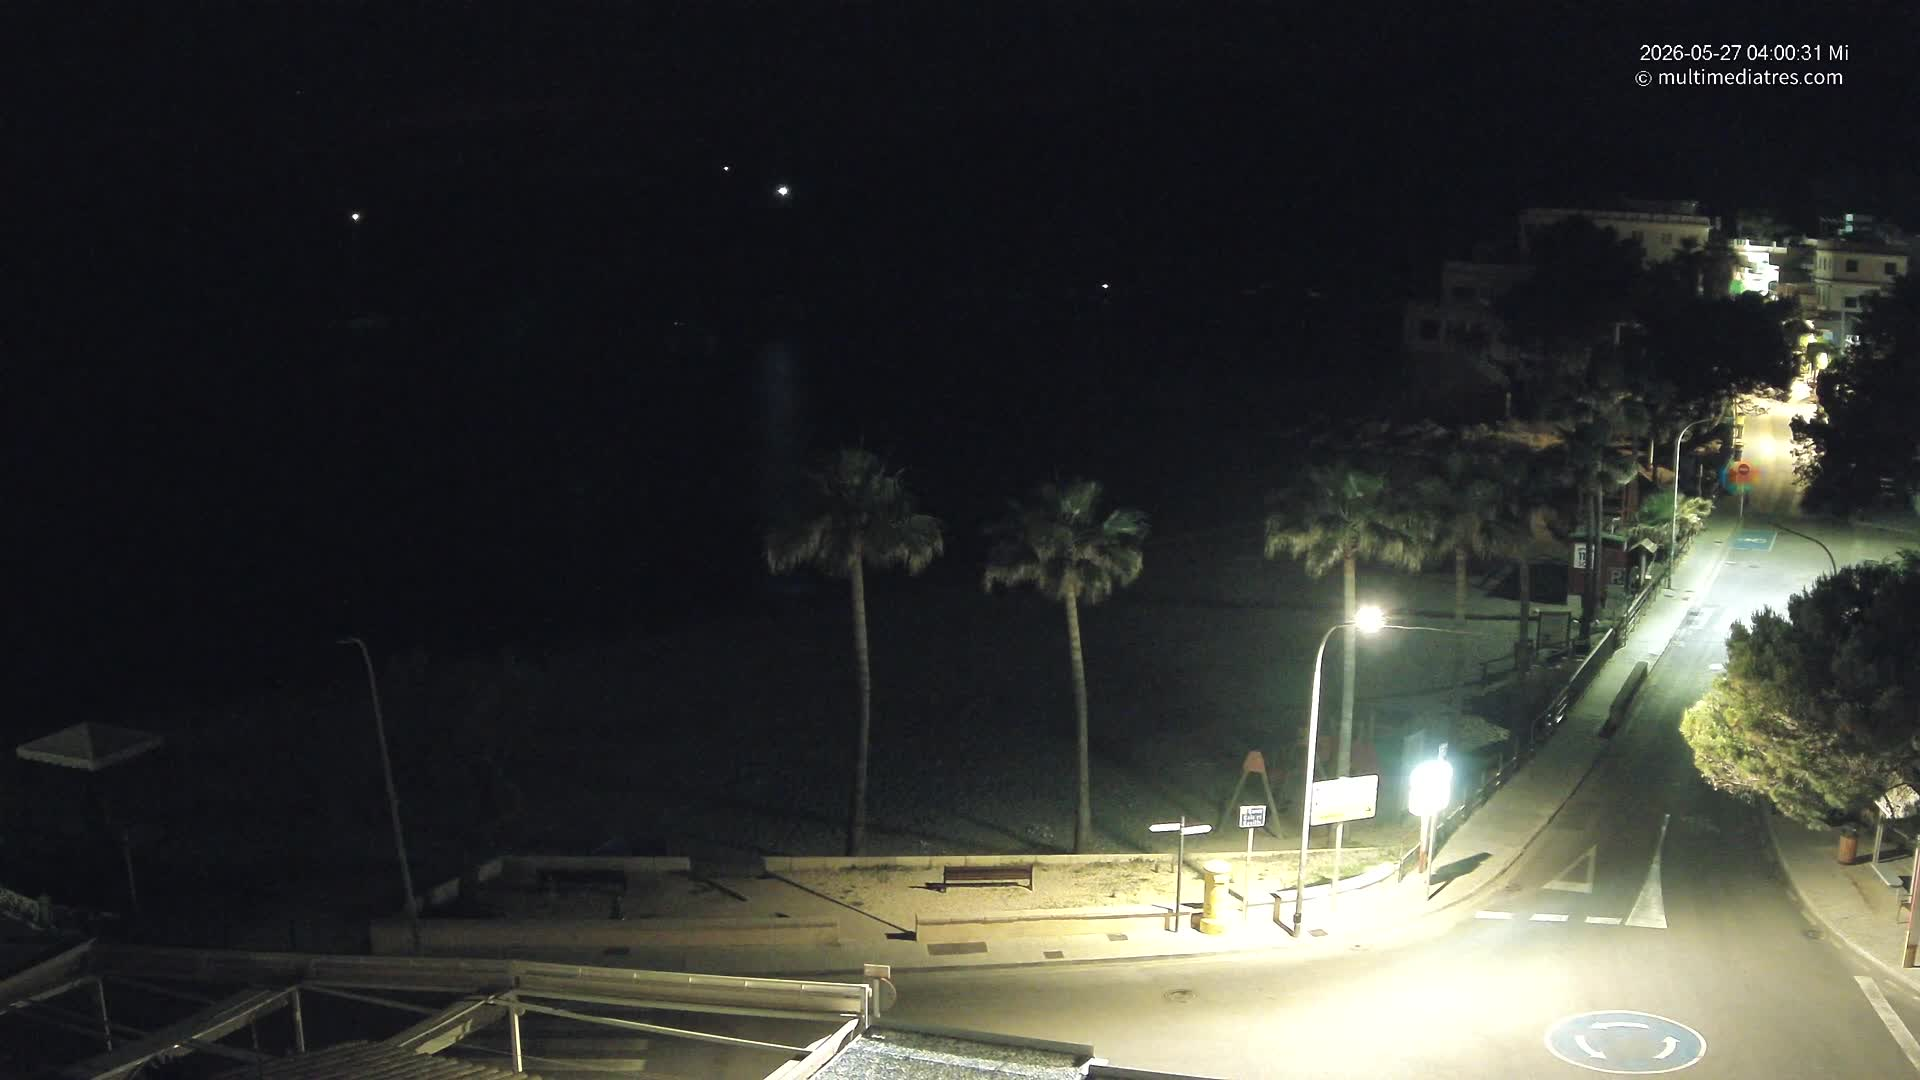
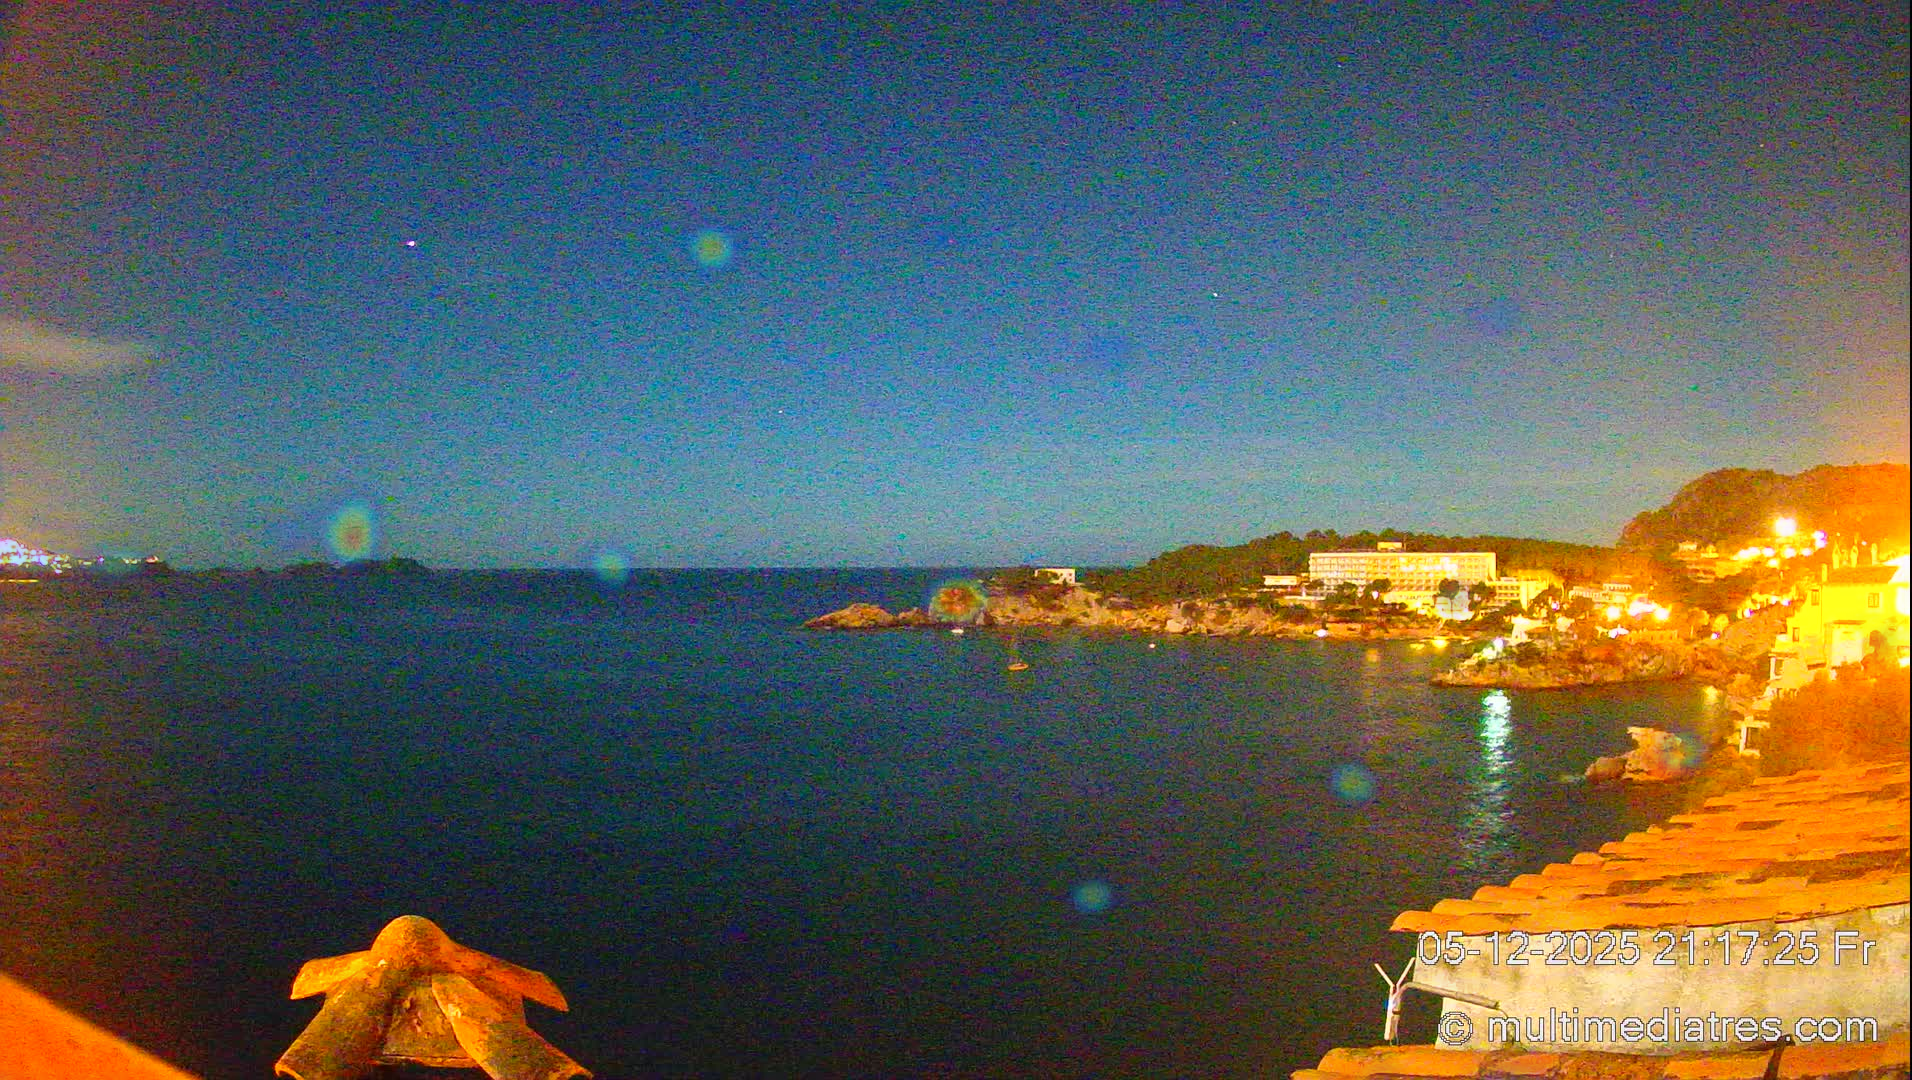
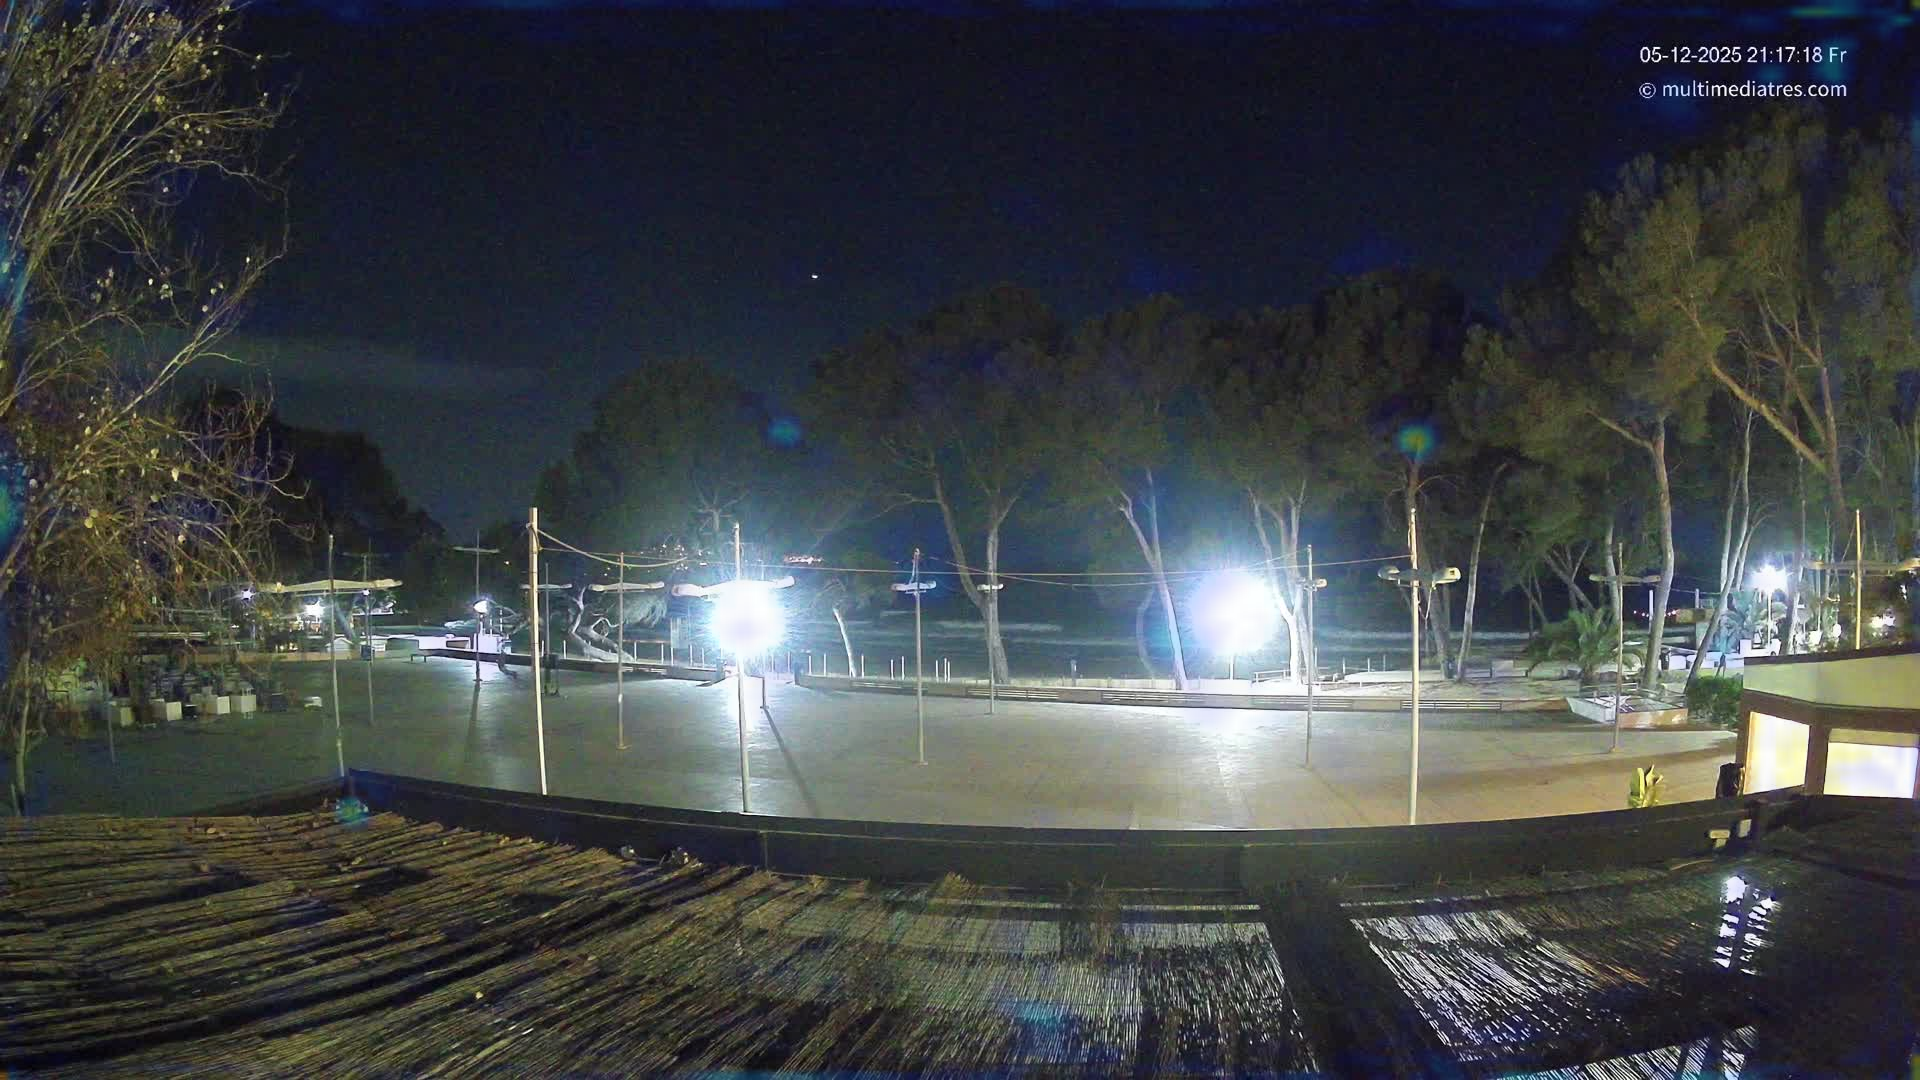
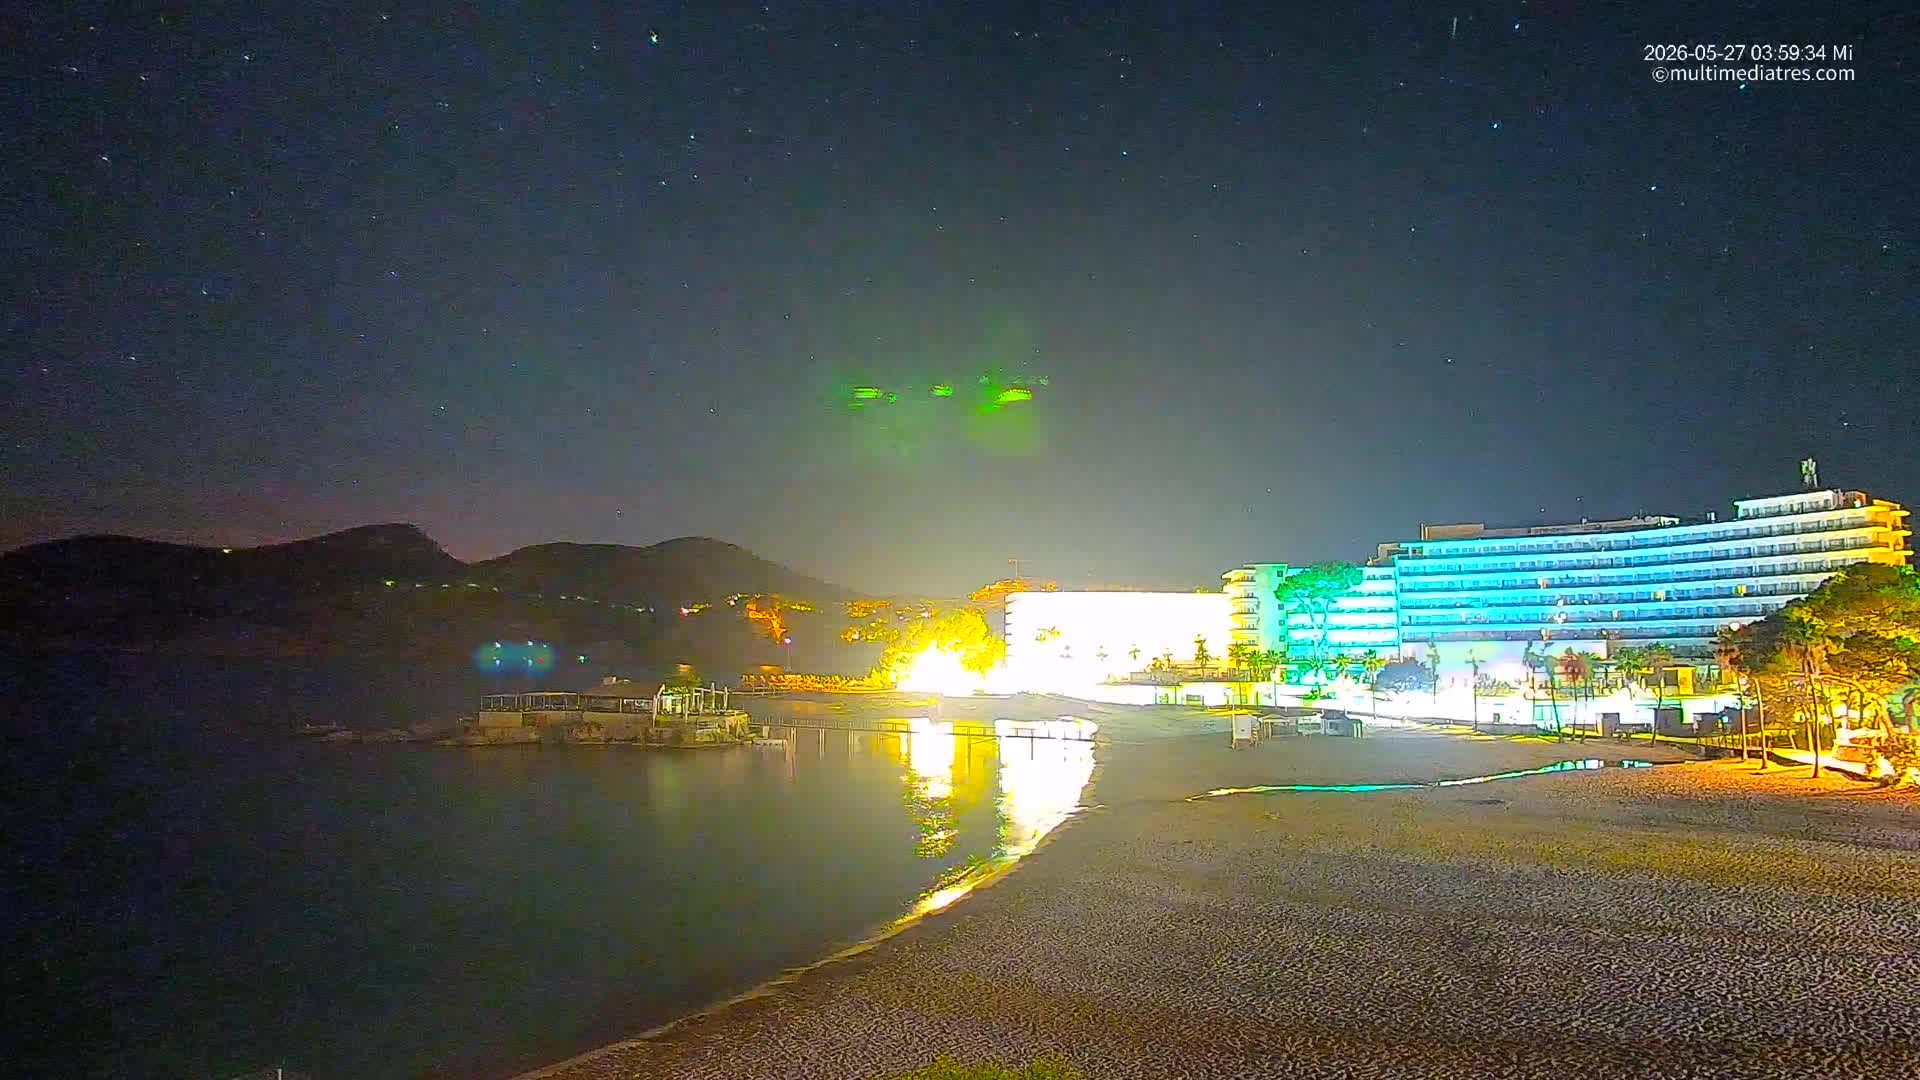
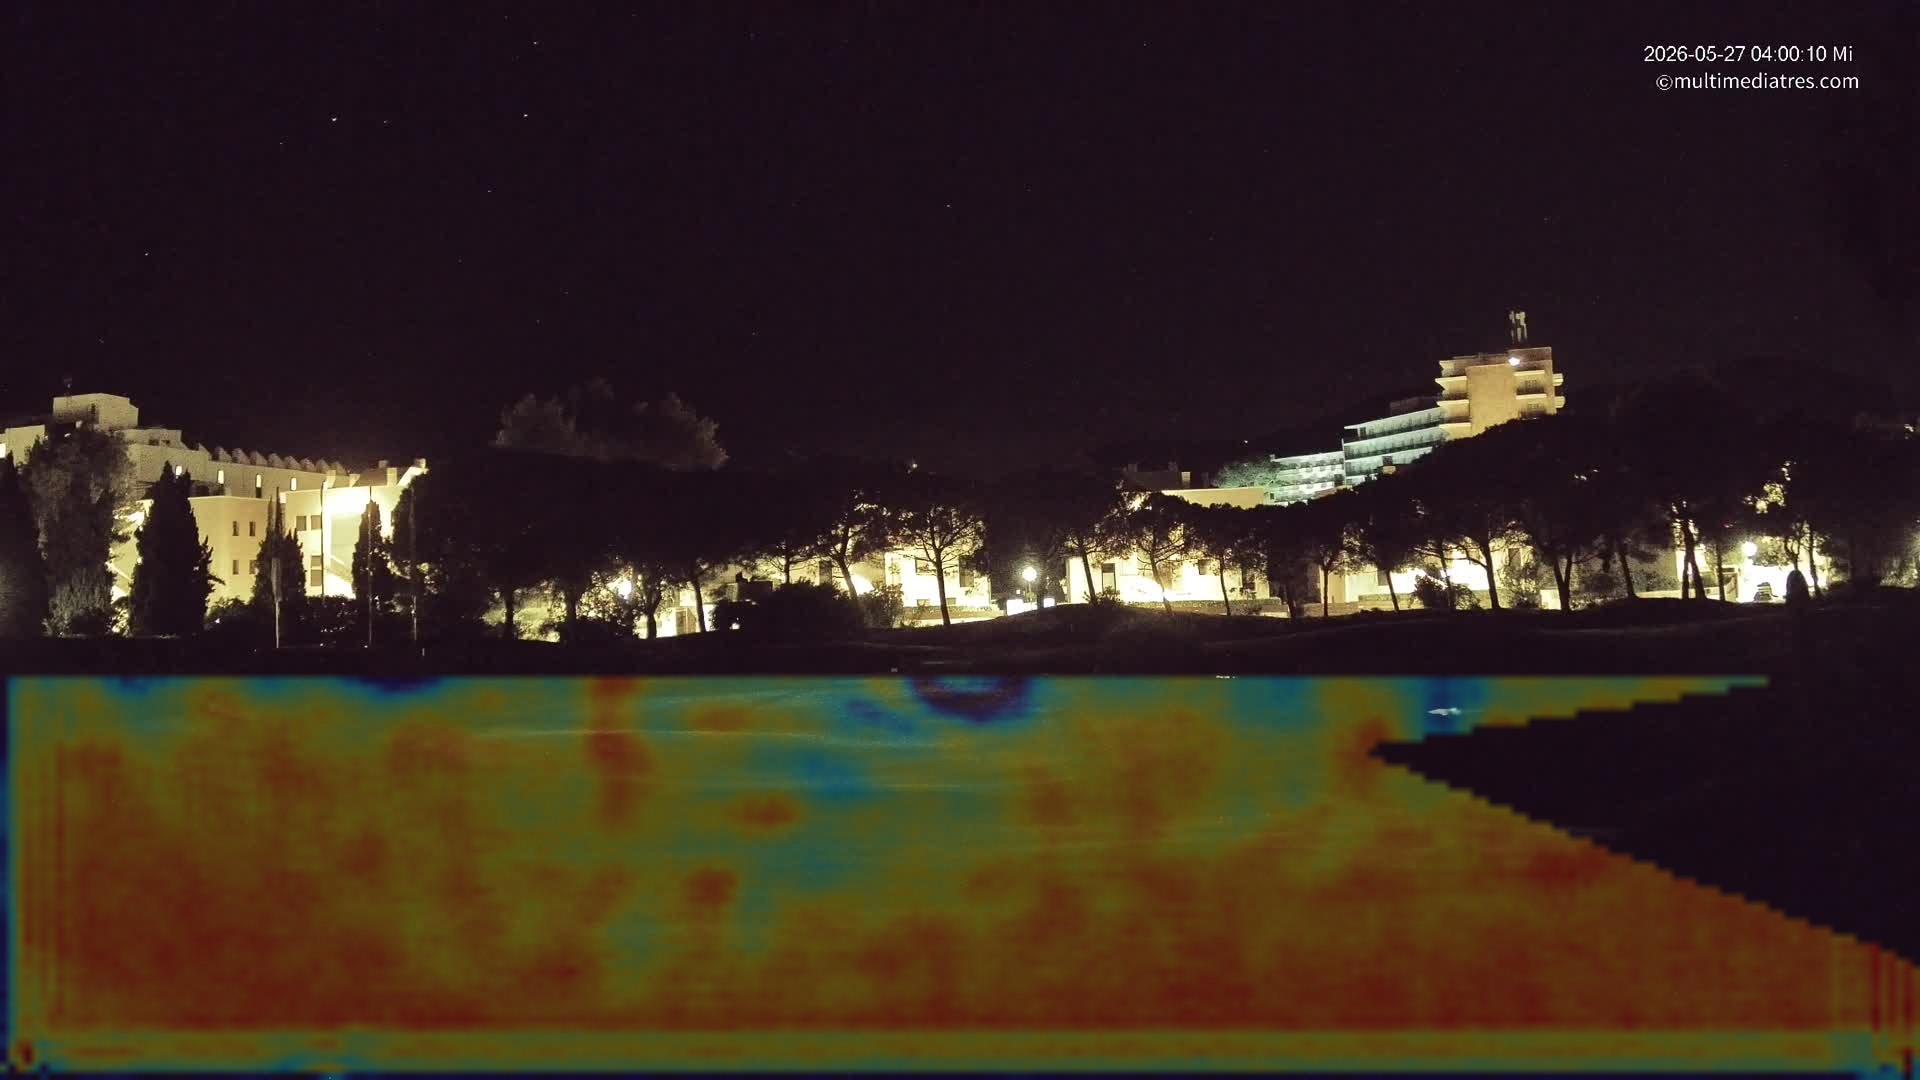
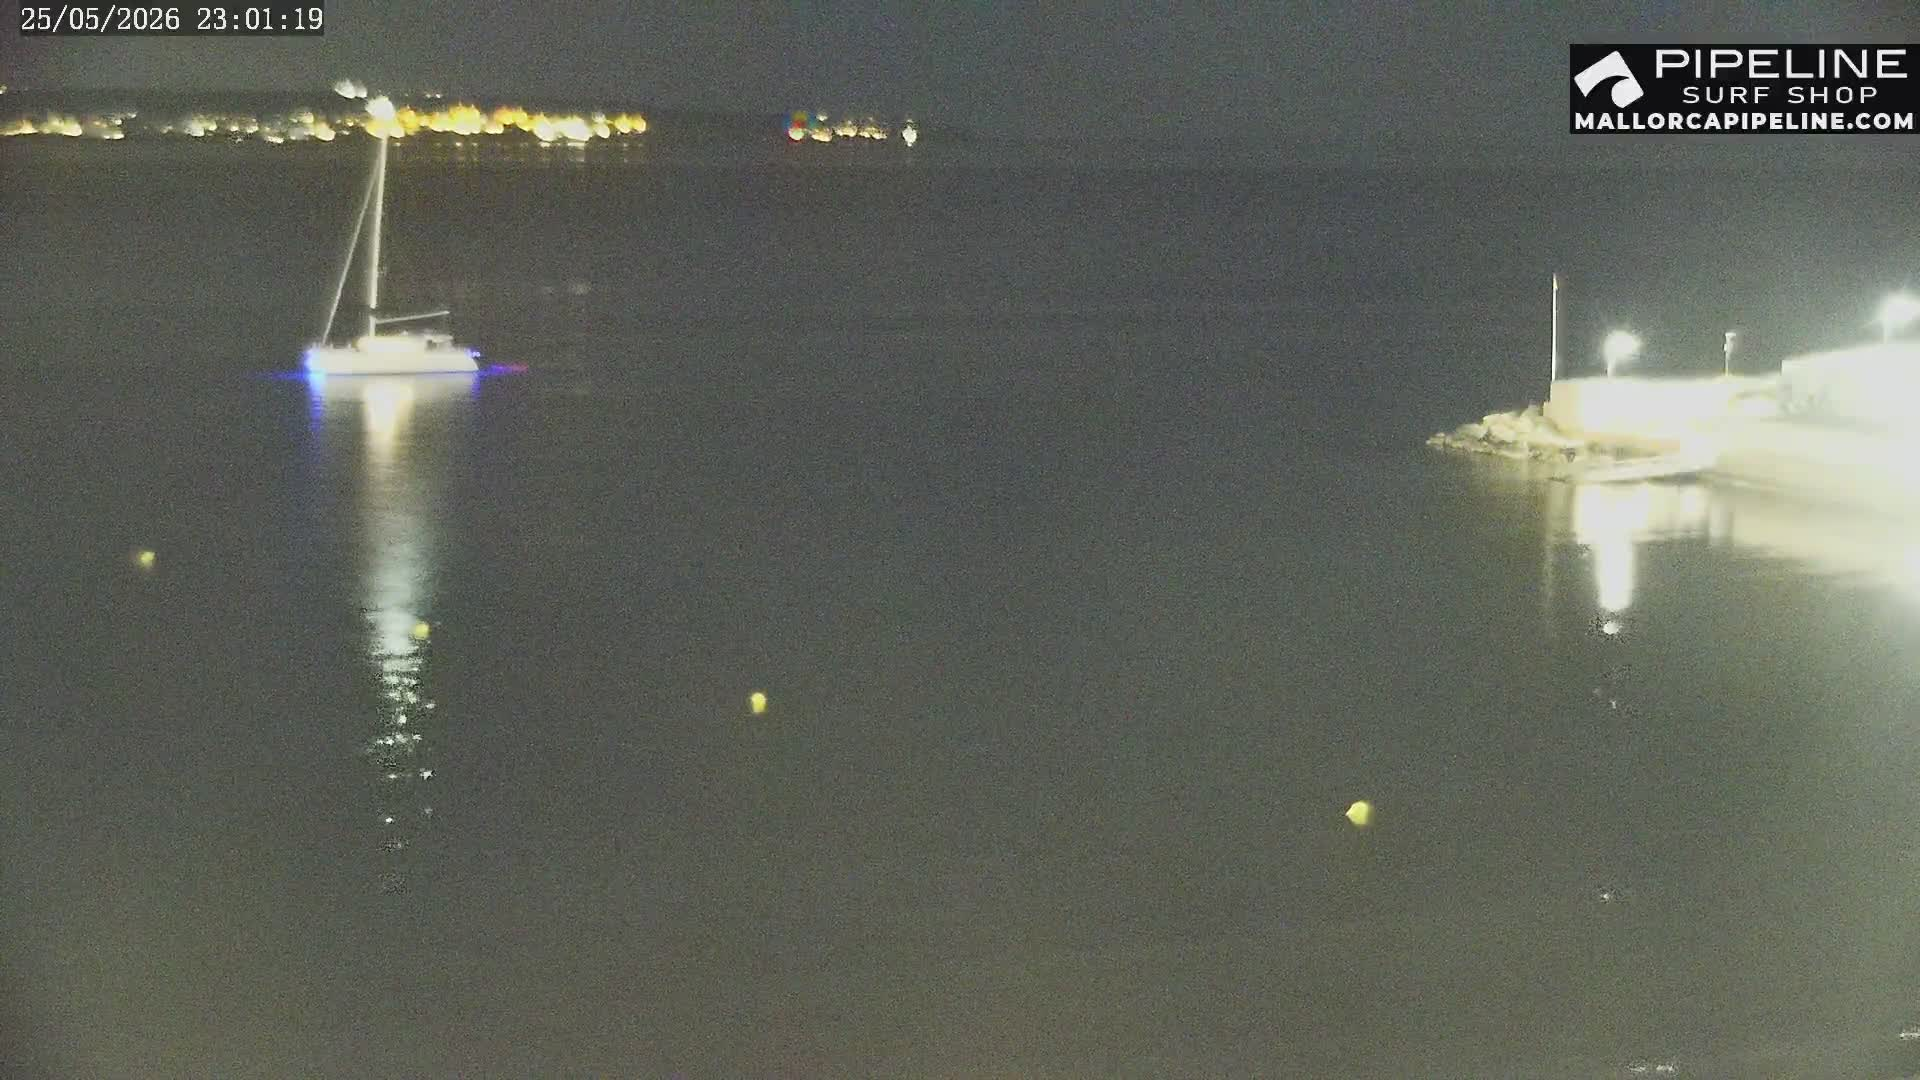
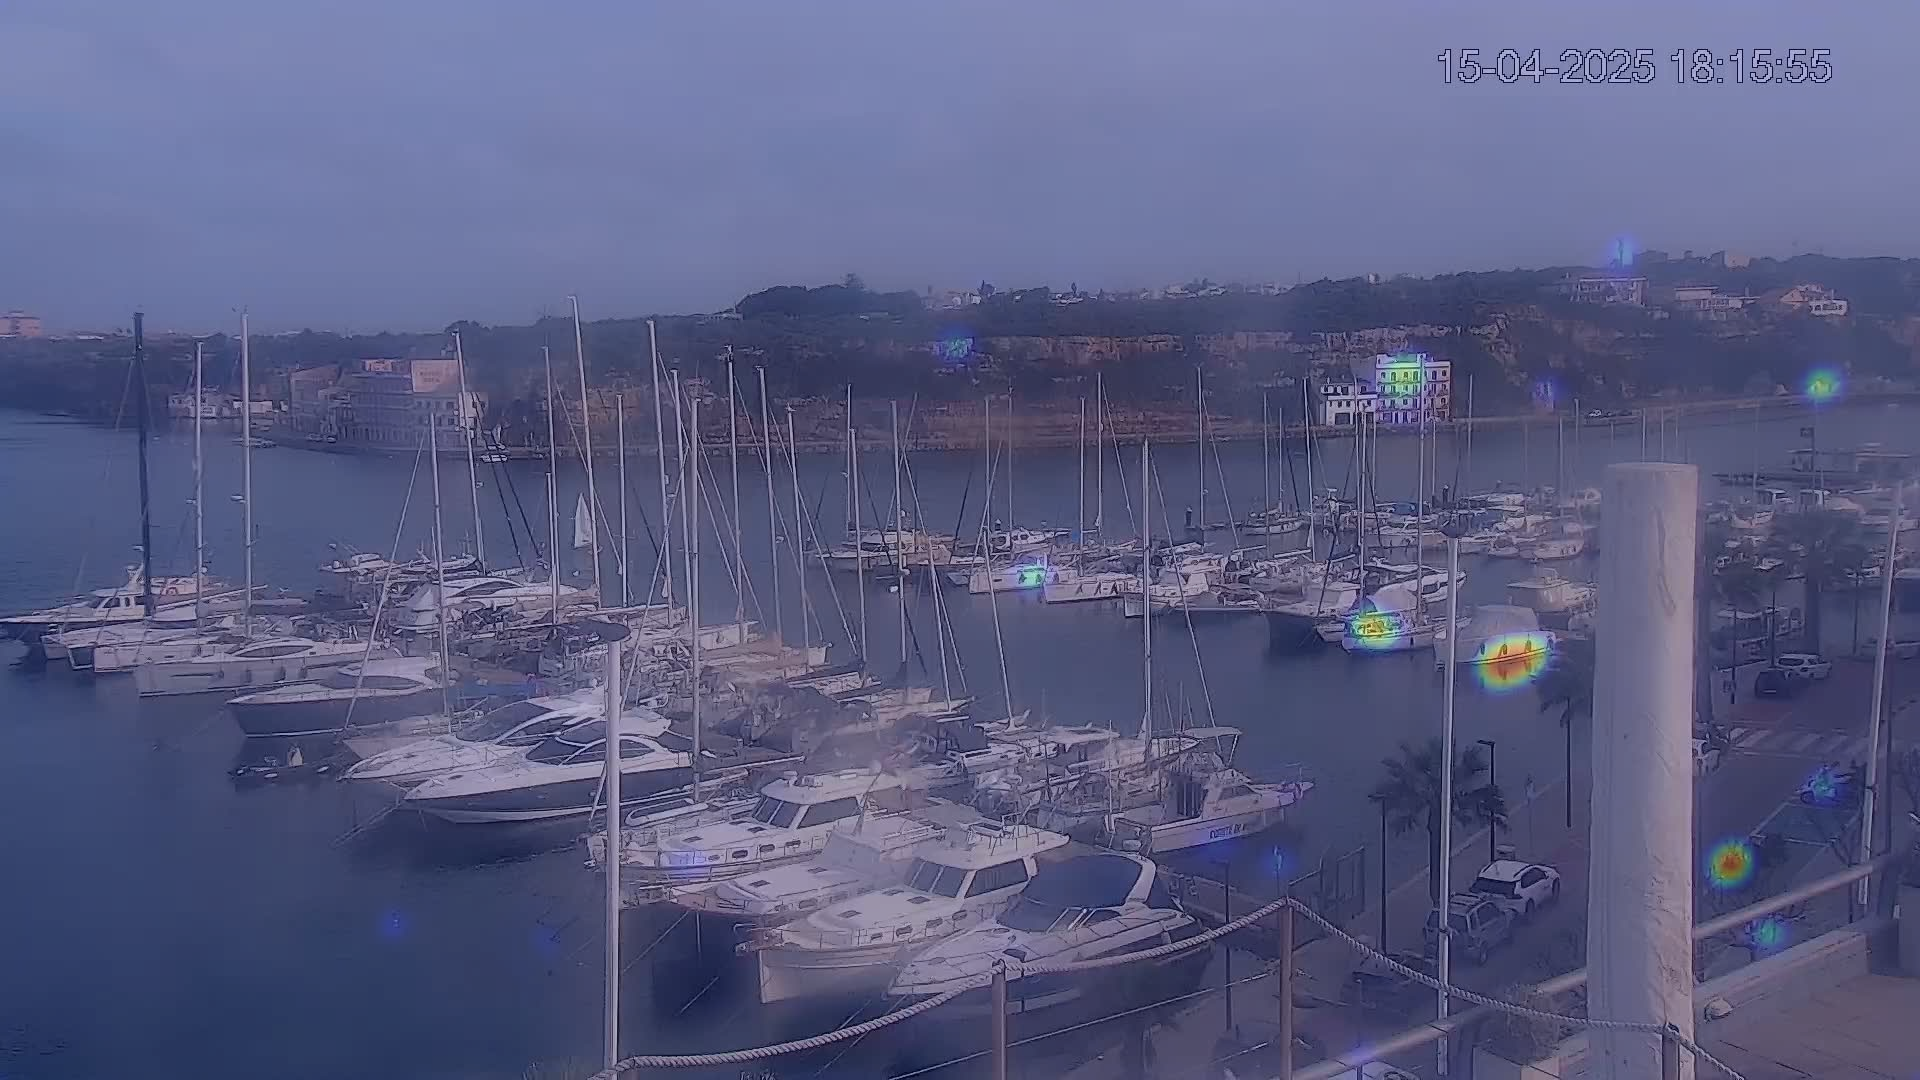
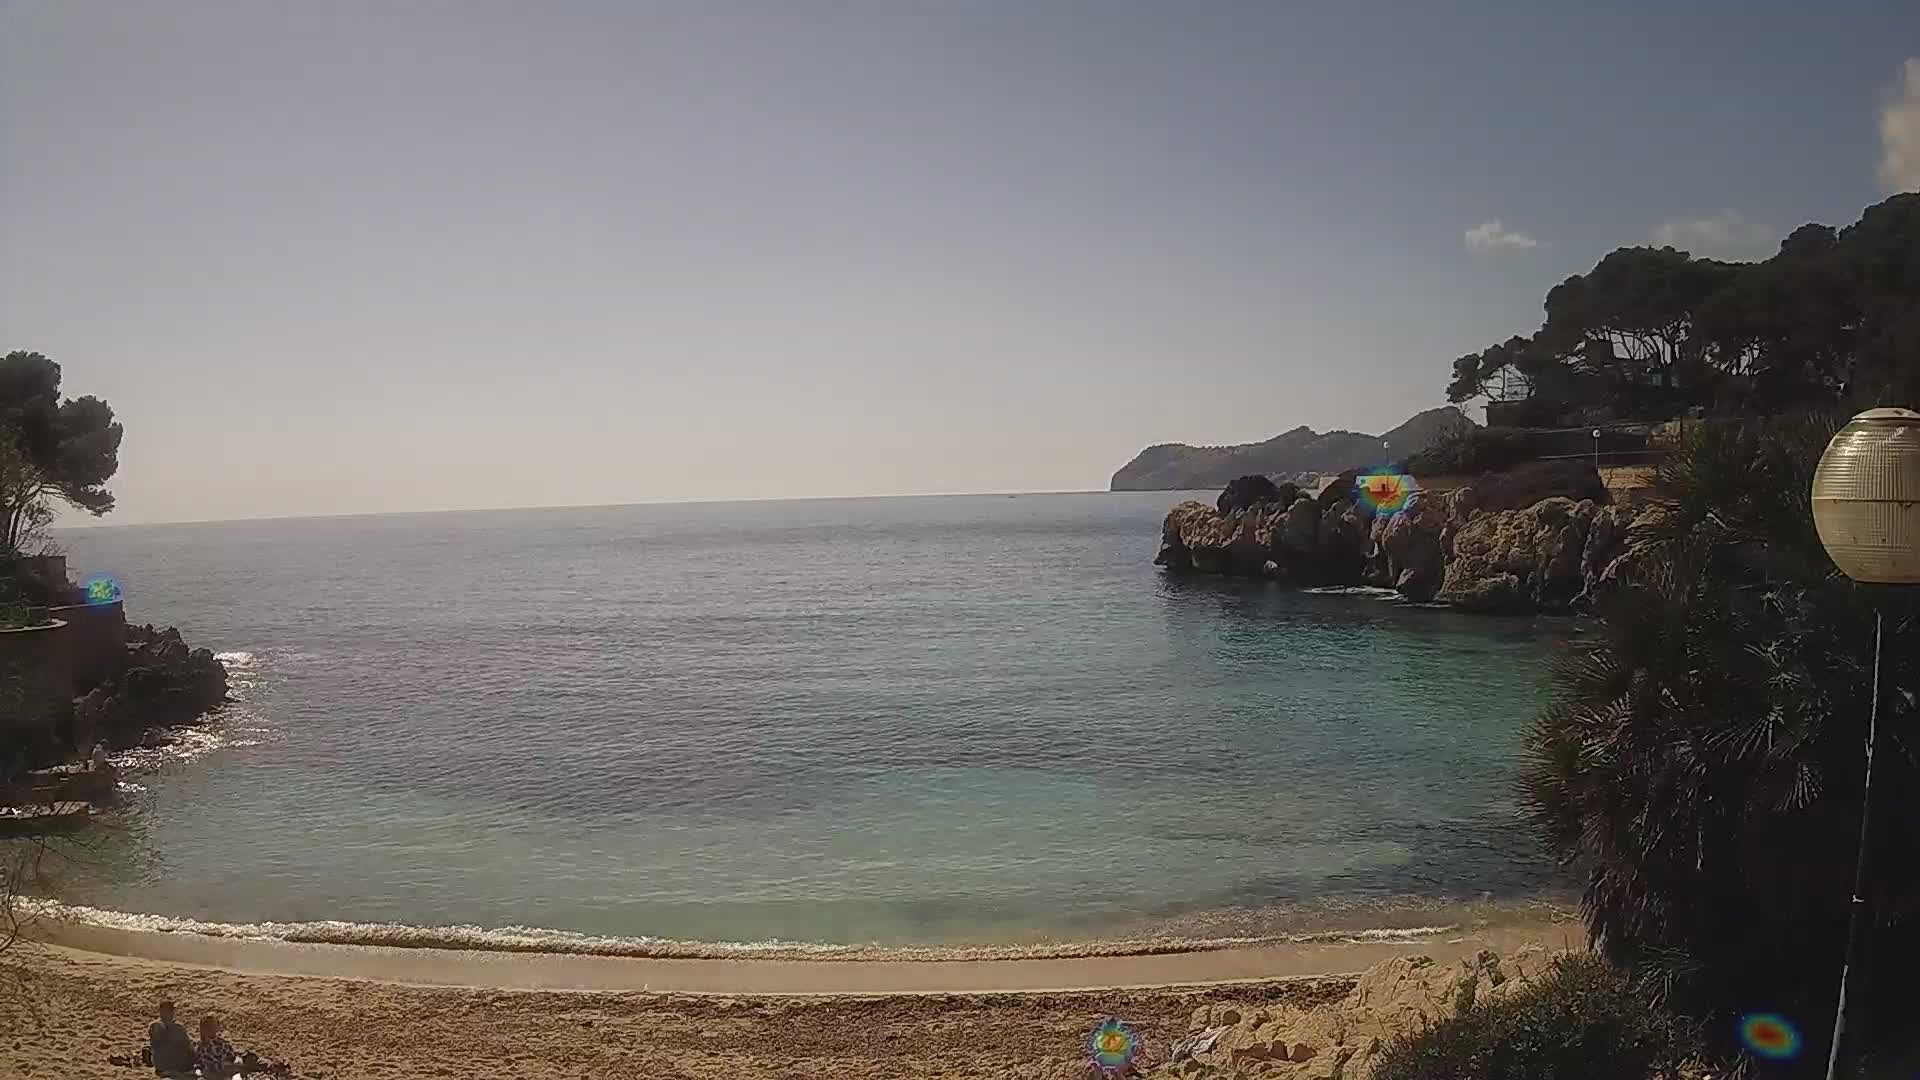
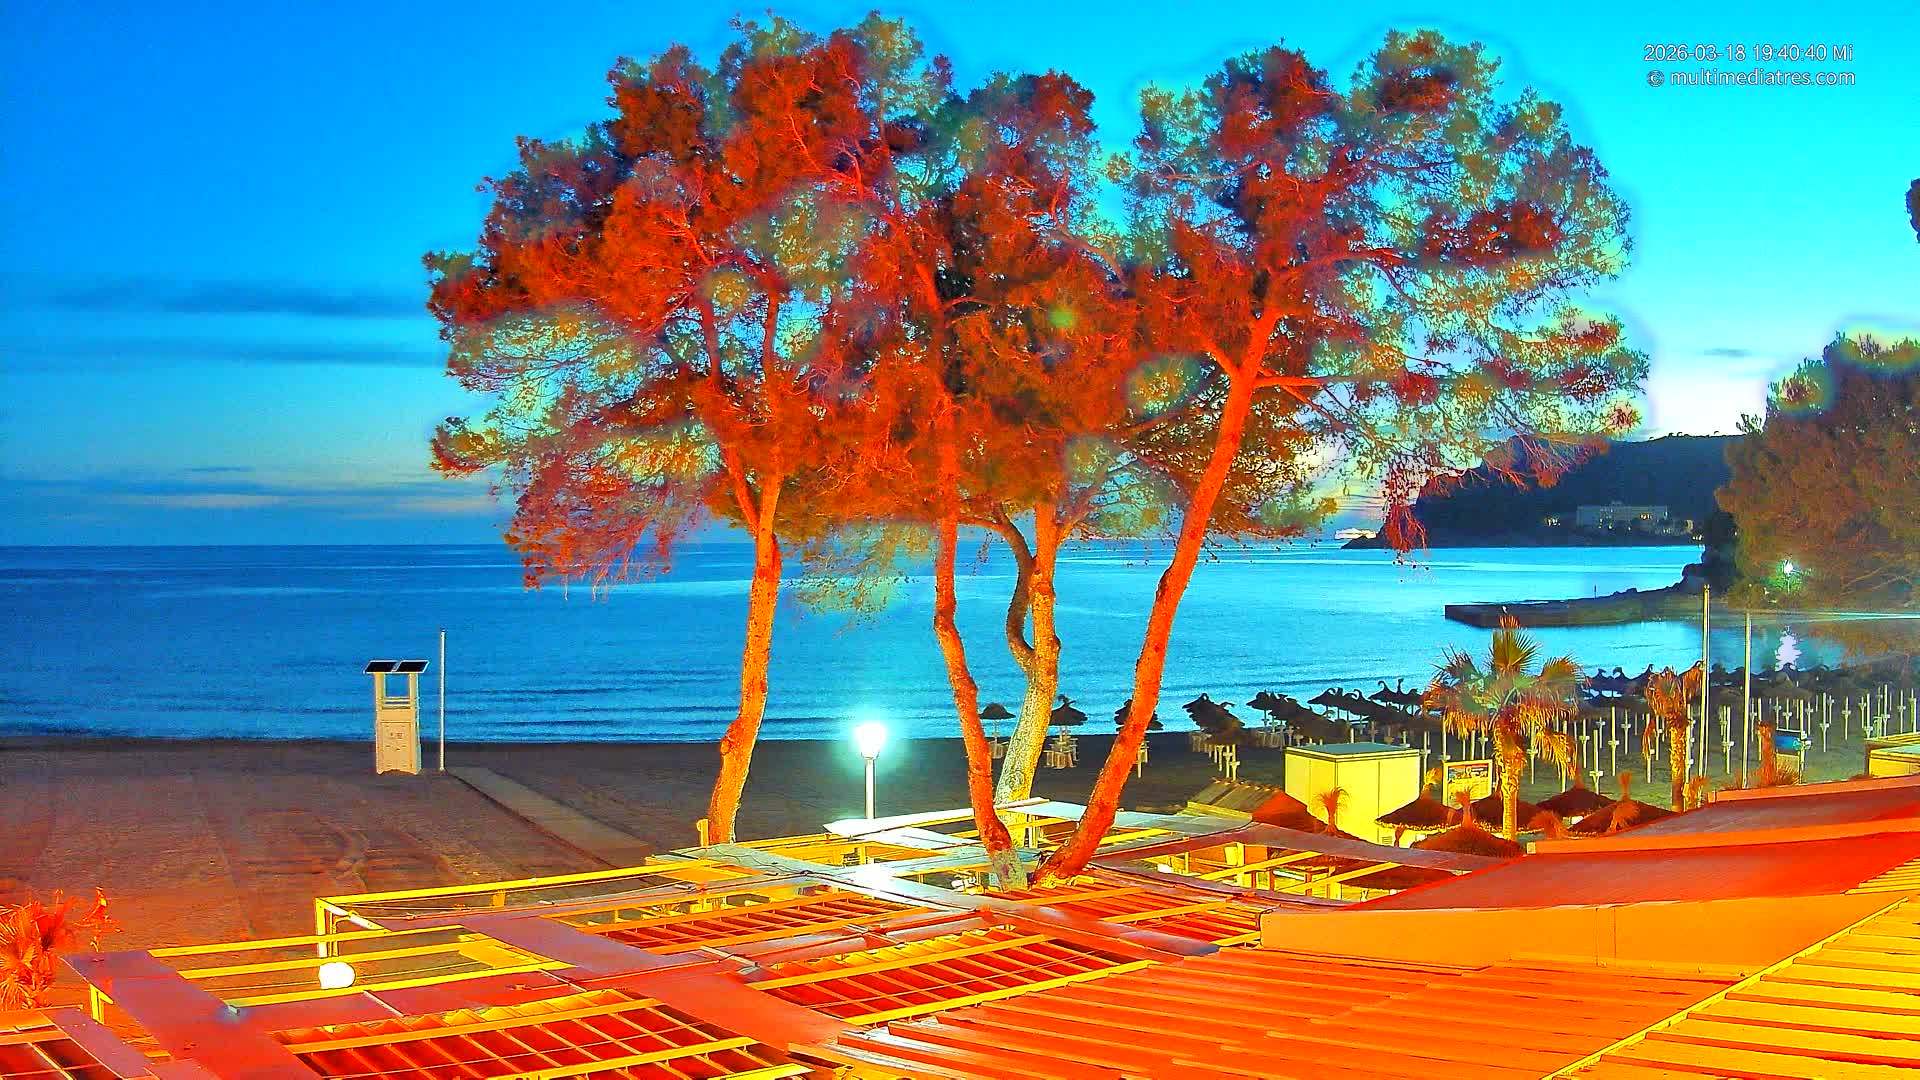
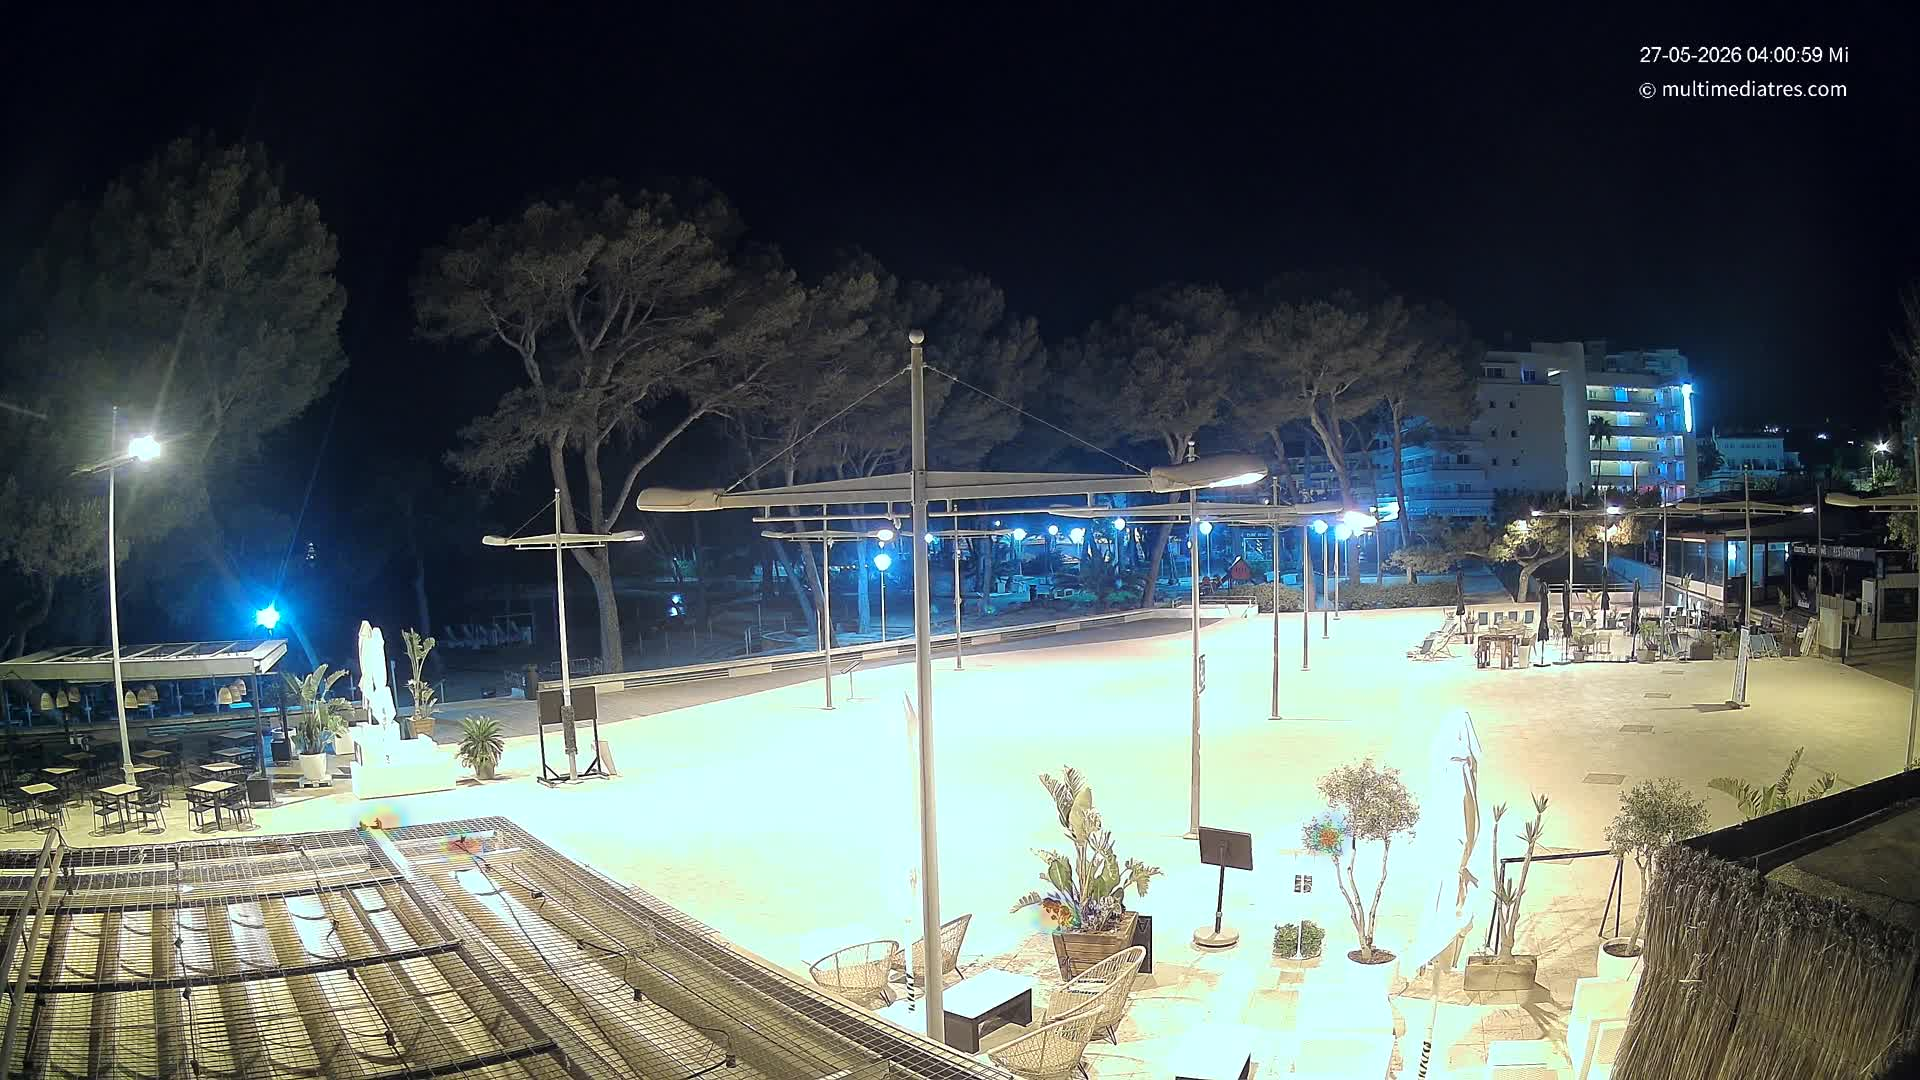
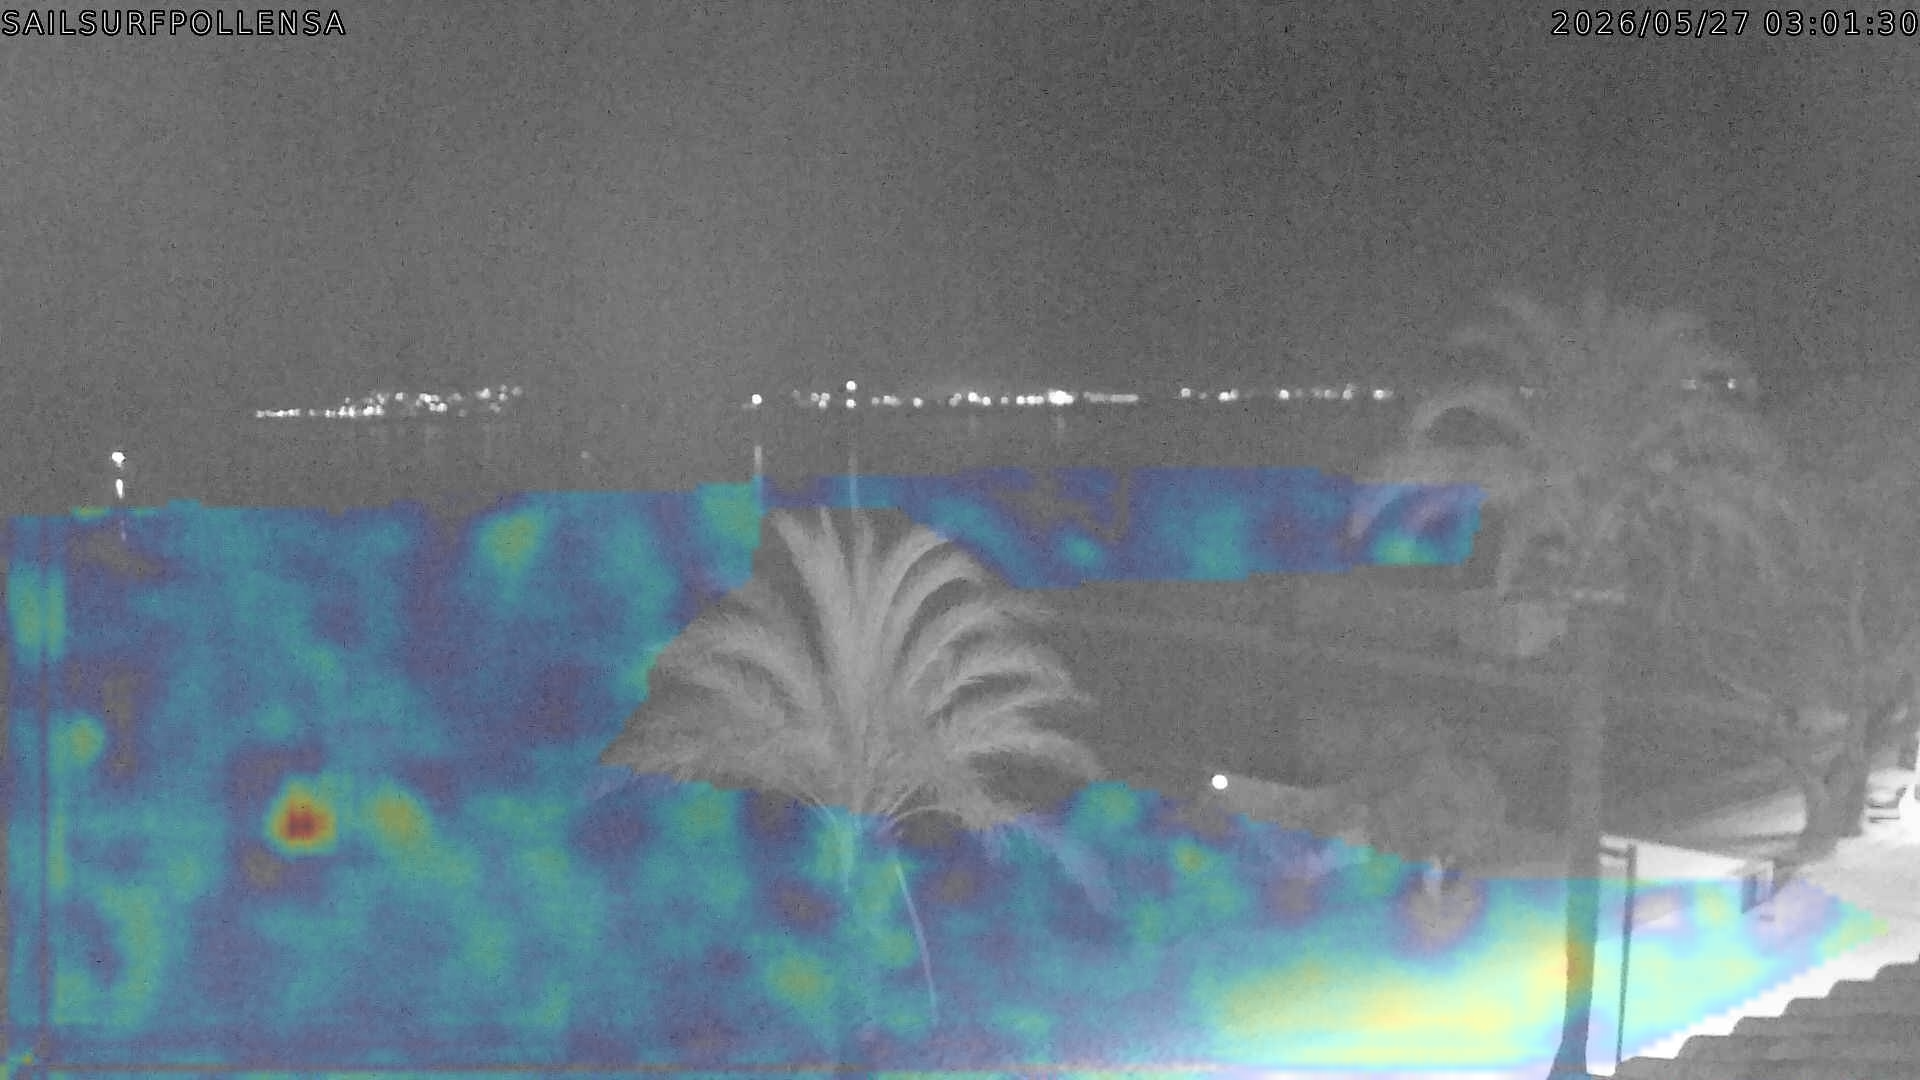
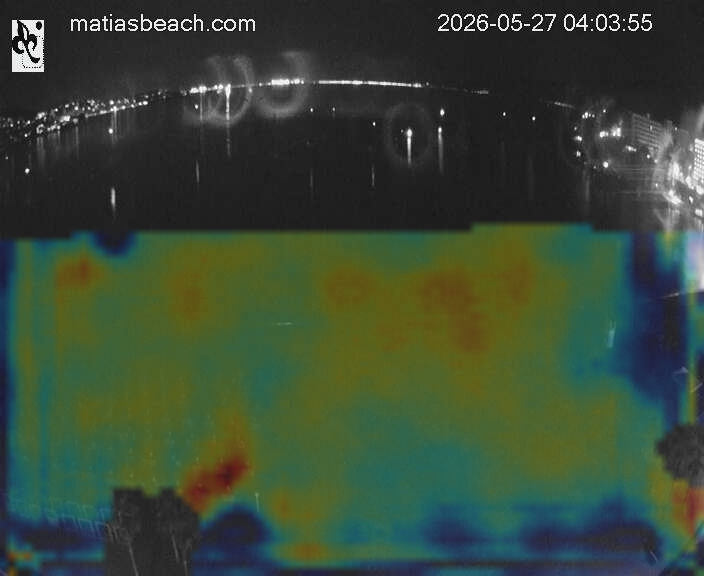
Estimación de la ocupación actual en Palma
Estimación: 45
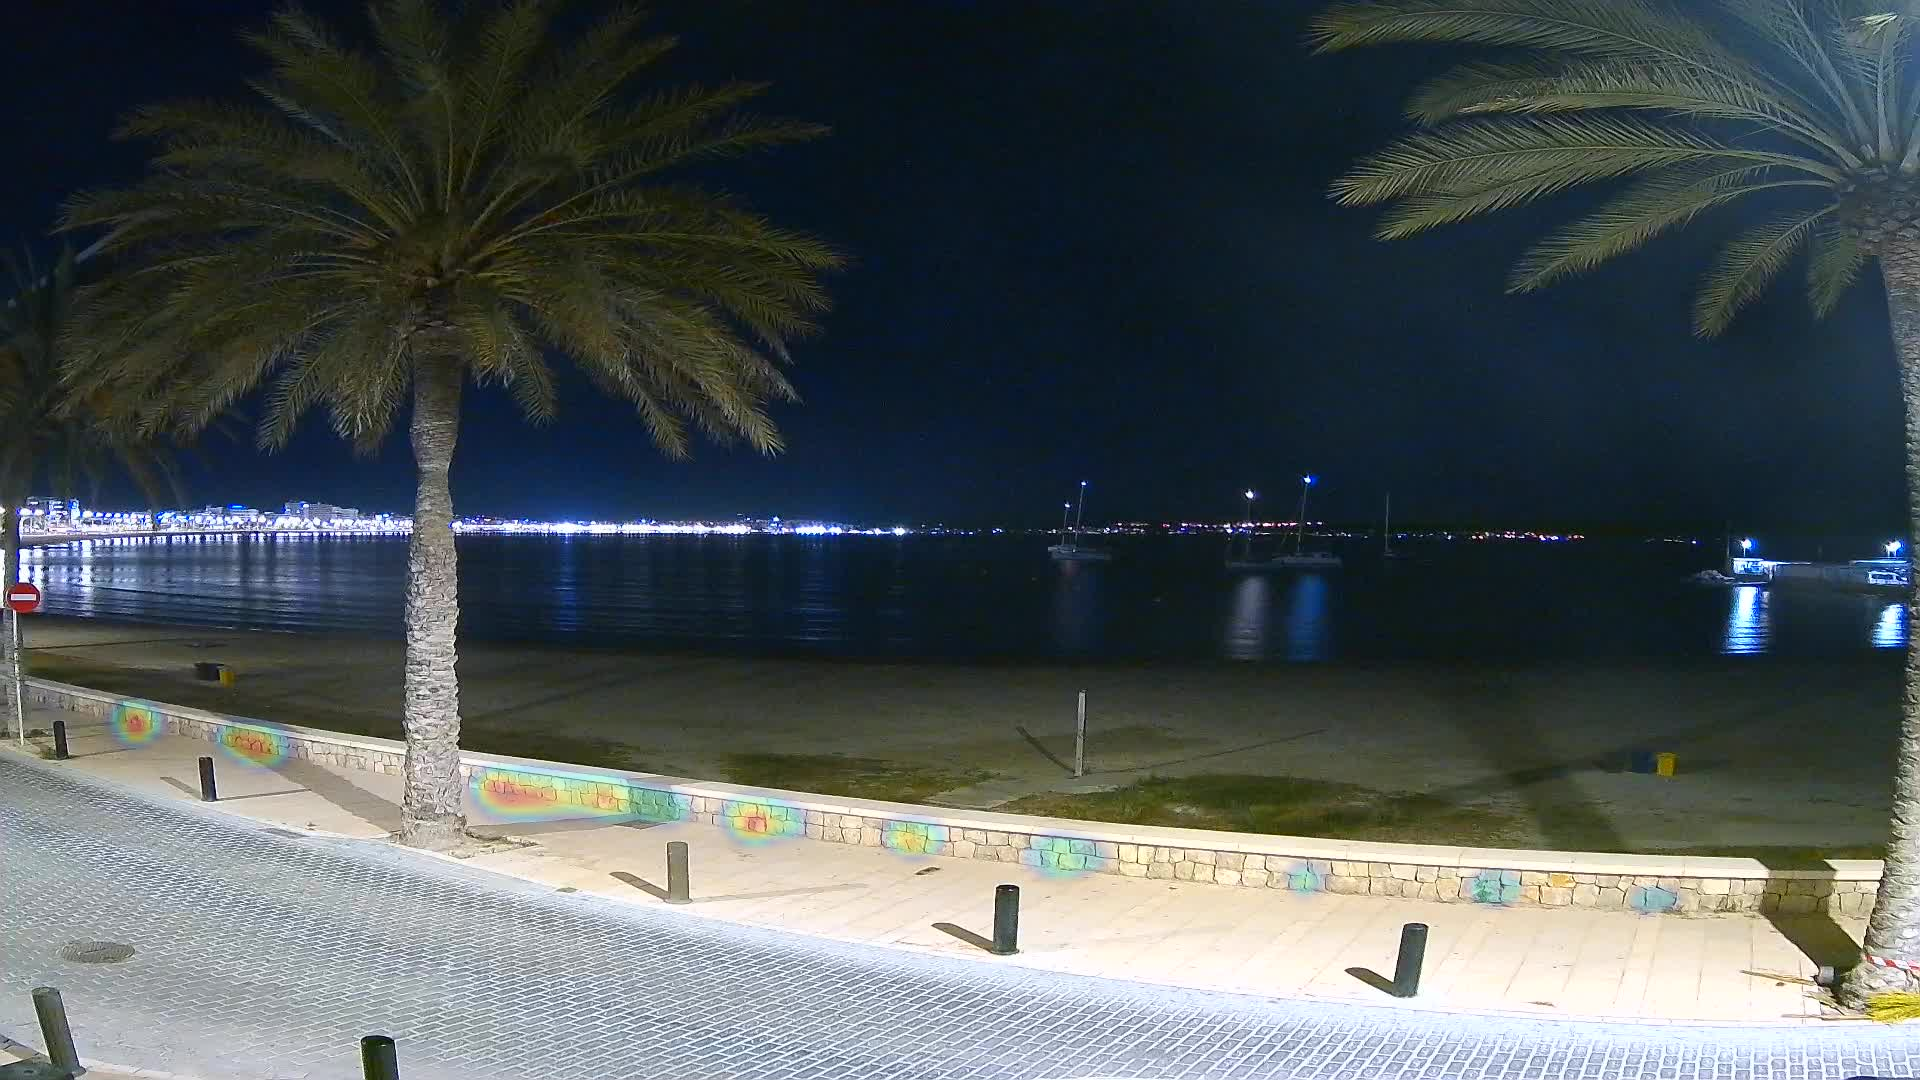 Fuente original: https://www.youtube.com/watch?v=VsQekhPeUKs
Previsión de Ocupación Futura
📅 Summary Cards (top row)
Three mini-charts show a quick occupancy snapshot: Tomorrow, This Weekend, and Next Weekend. Bars are coloured by occupancy level (see legend below). The orange line is the forecast temperature. Hover over any bar to see the exact predicted crowd count and temperature for that hour.
📈 Forecast Charts (3 / 10 / 15 days)
Detailed hourly charts at three forecast horizons. Bars show occupancy as a % of beach capacity, coloured by level. Light-blue bands mark weekends. The orange line is temperature (°C, right axis). Hover for details. Accuracy decreases at longer horizons.
⚗️ Model Comparison Widget
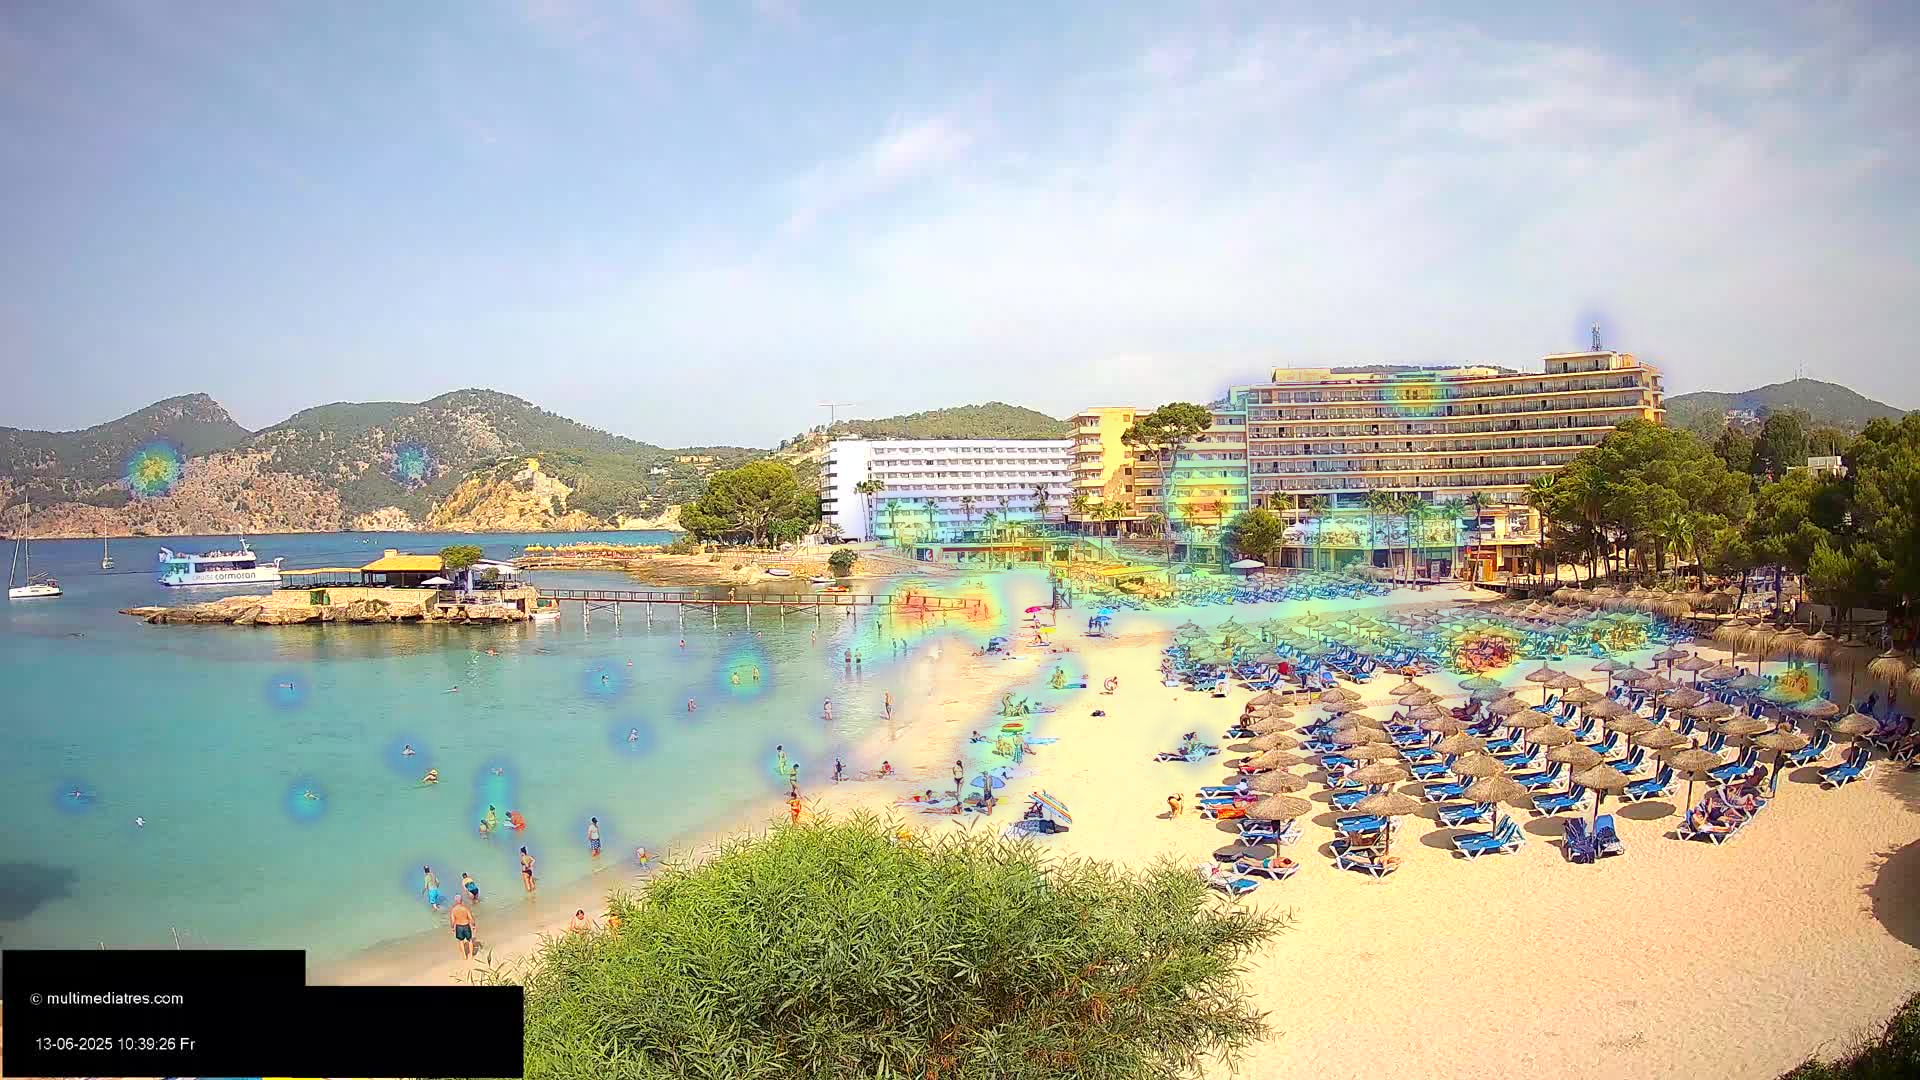
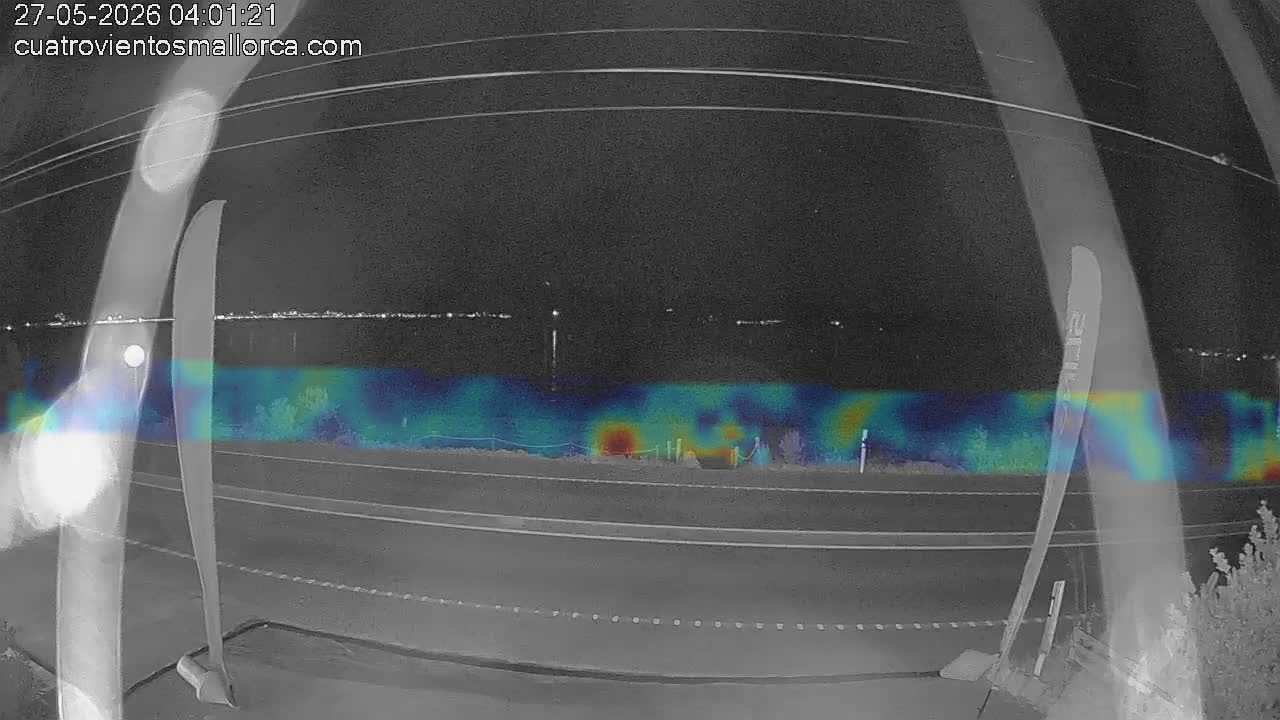
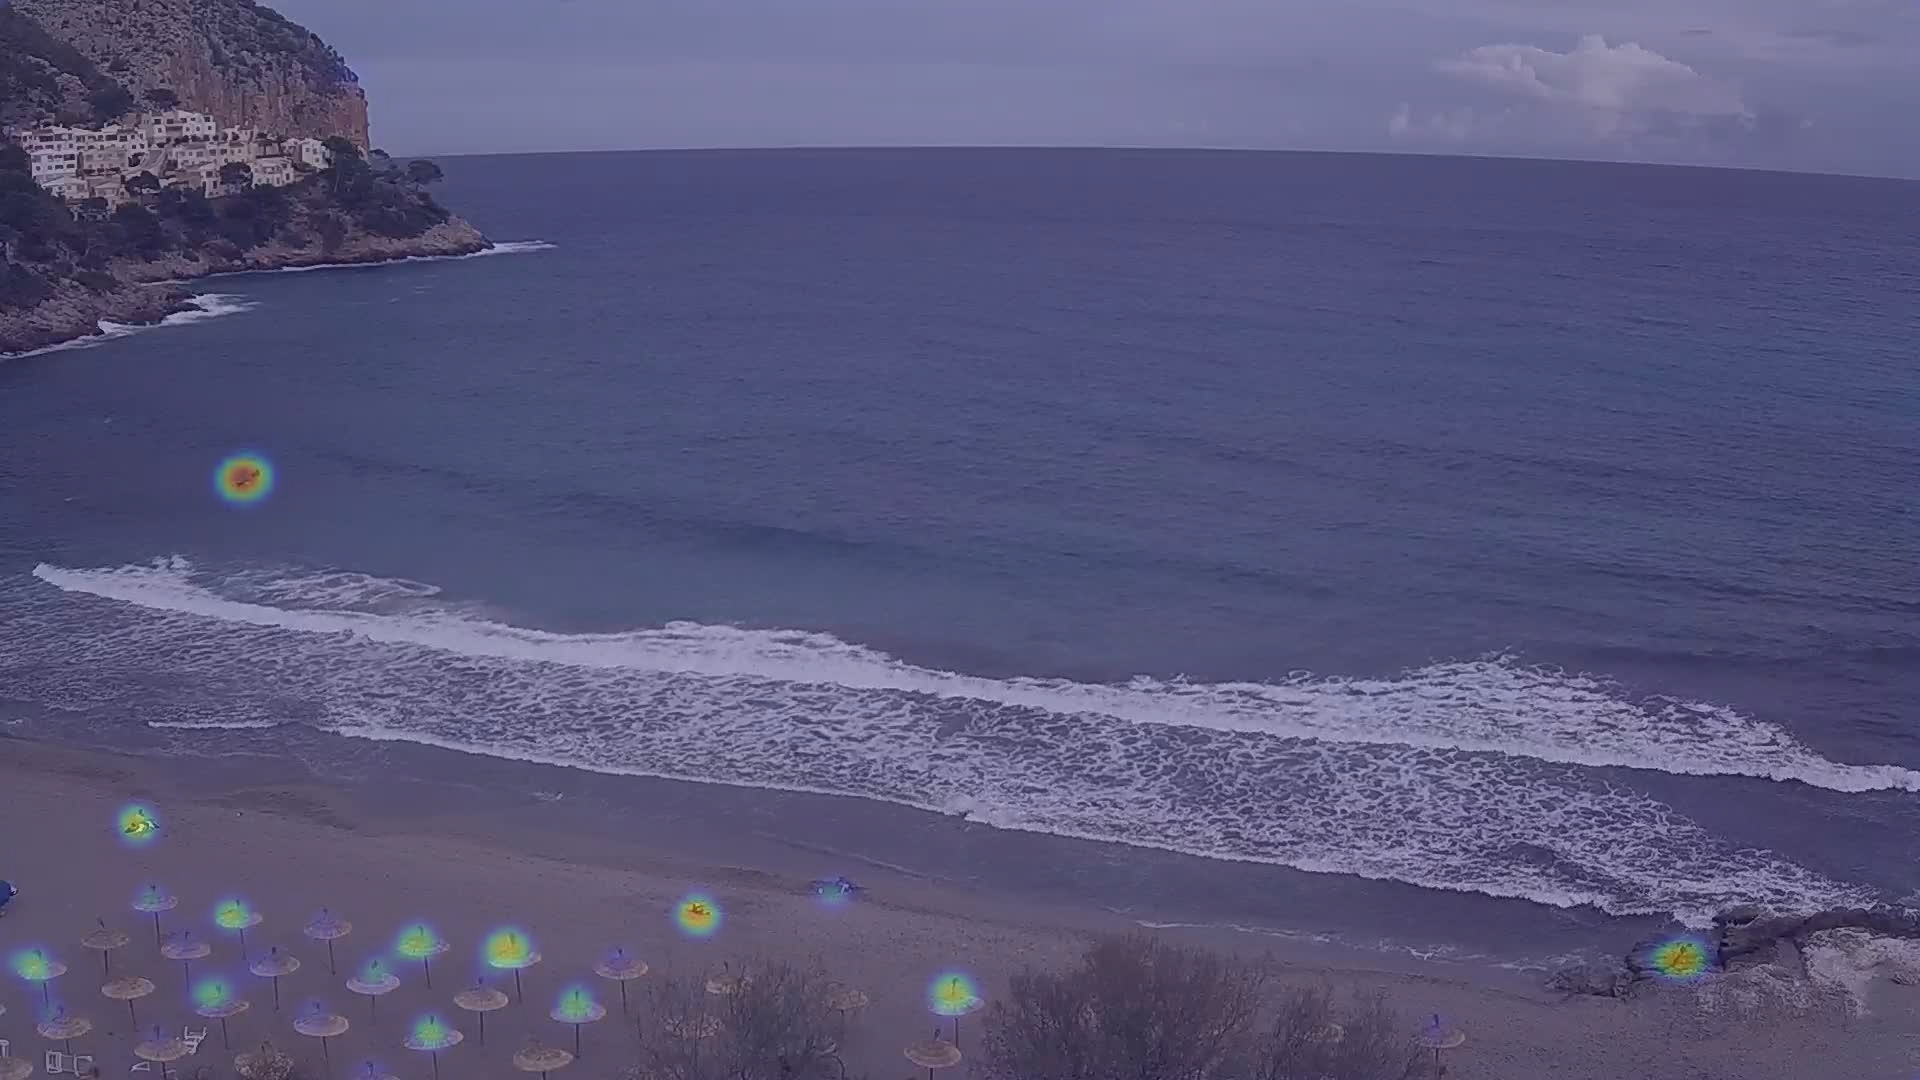
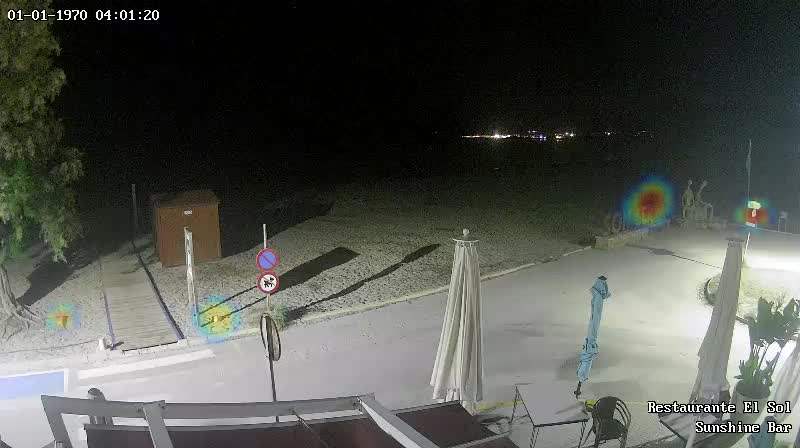
Pick a past date and up to 3 model sets to run a hindcast side by side. Coloured bars show each model's predictions; the red line is actual occupancy. Click any bar to load the webcam image and density-map for that hour.
📊 Looking for CV metrics, model rankings, or input features? Those have moved to the Model Report page (Forecast → Model Report).
Mañana
Este fin de semana
Próximo fin de semana
Previsión a 3 días
Previsión a 10 días
Previsión a 15 días
⚗️ Model Comparison
Select a past date range and up to 3 model sets, then click Compare. Click any bar on the chart to view the original webcam image and prediction map for that hour.
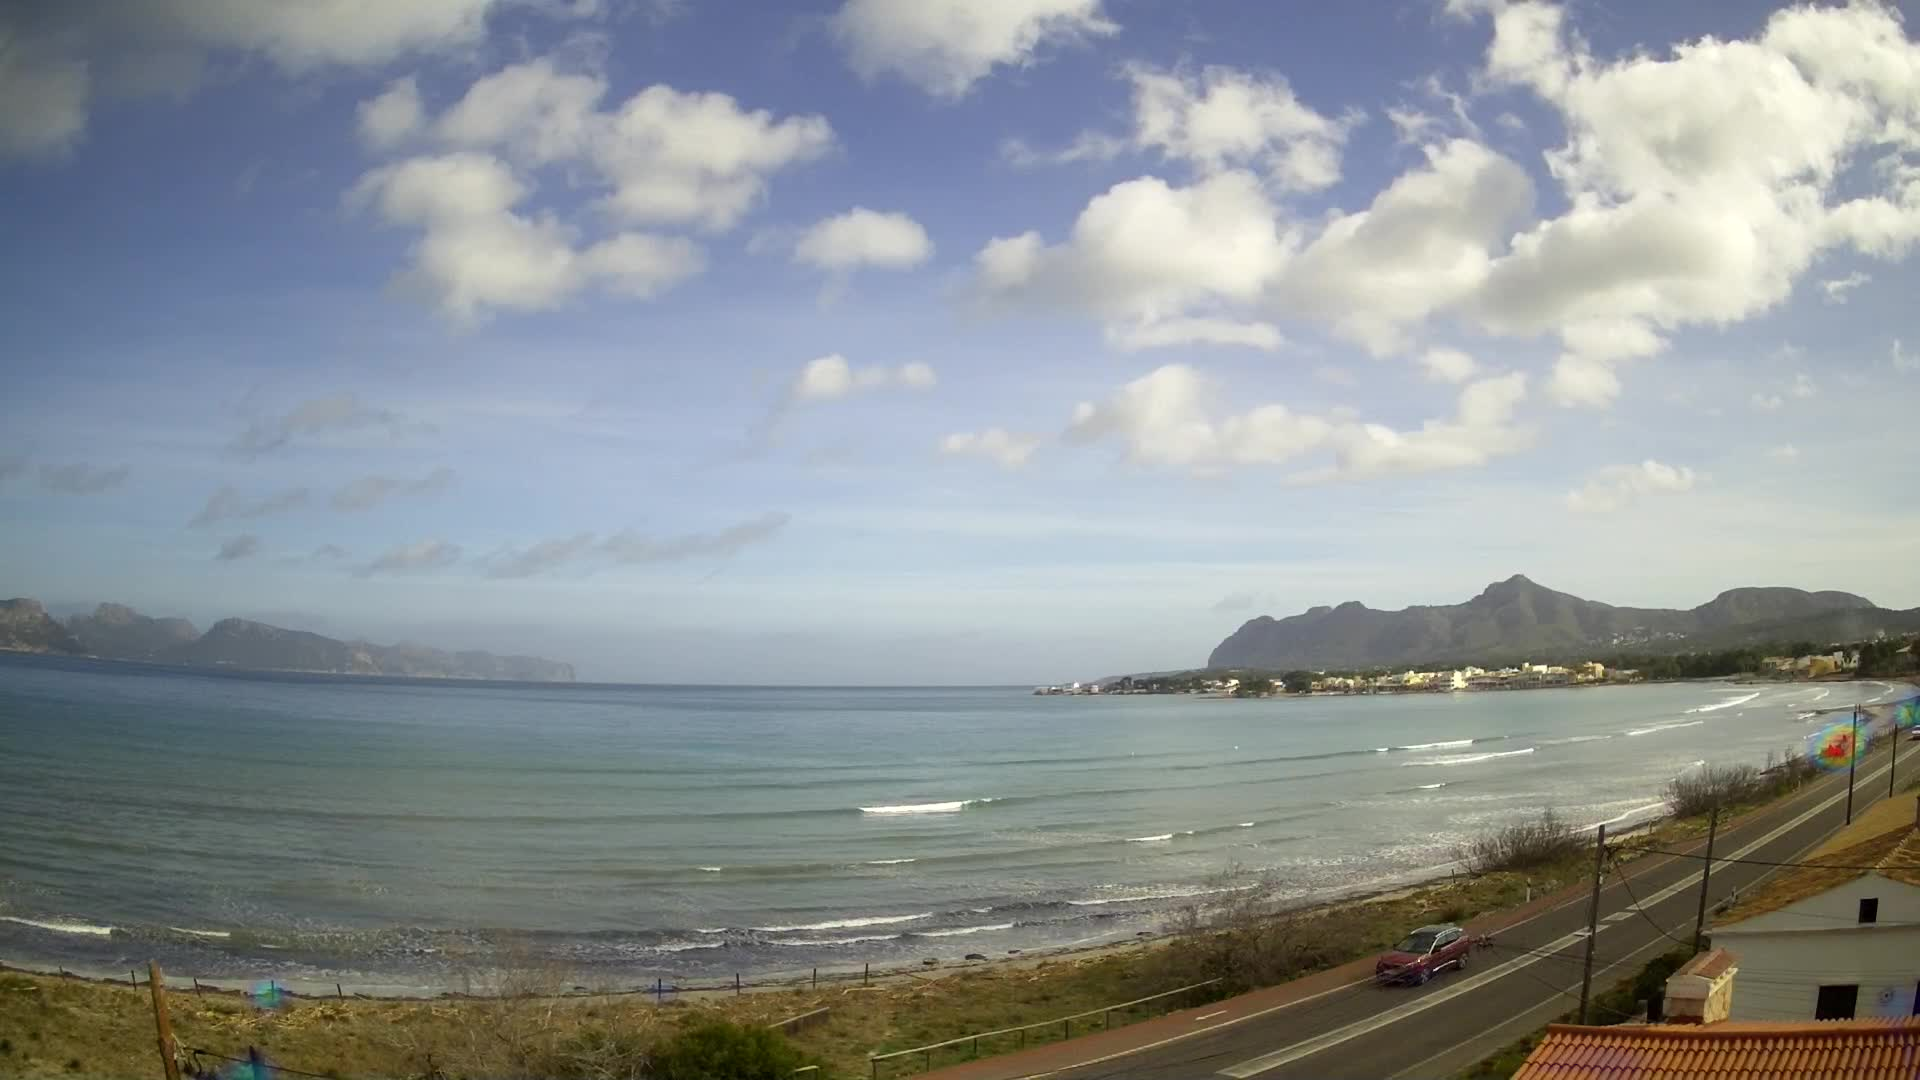
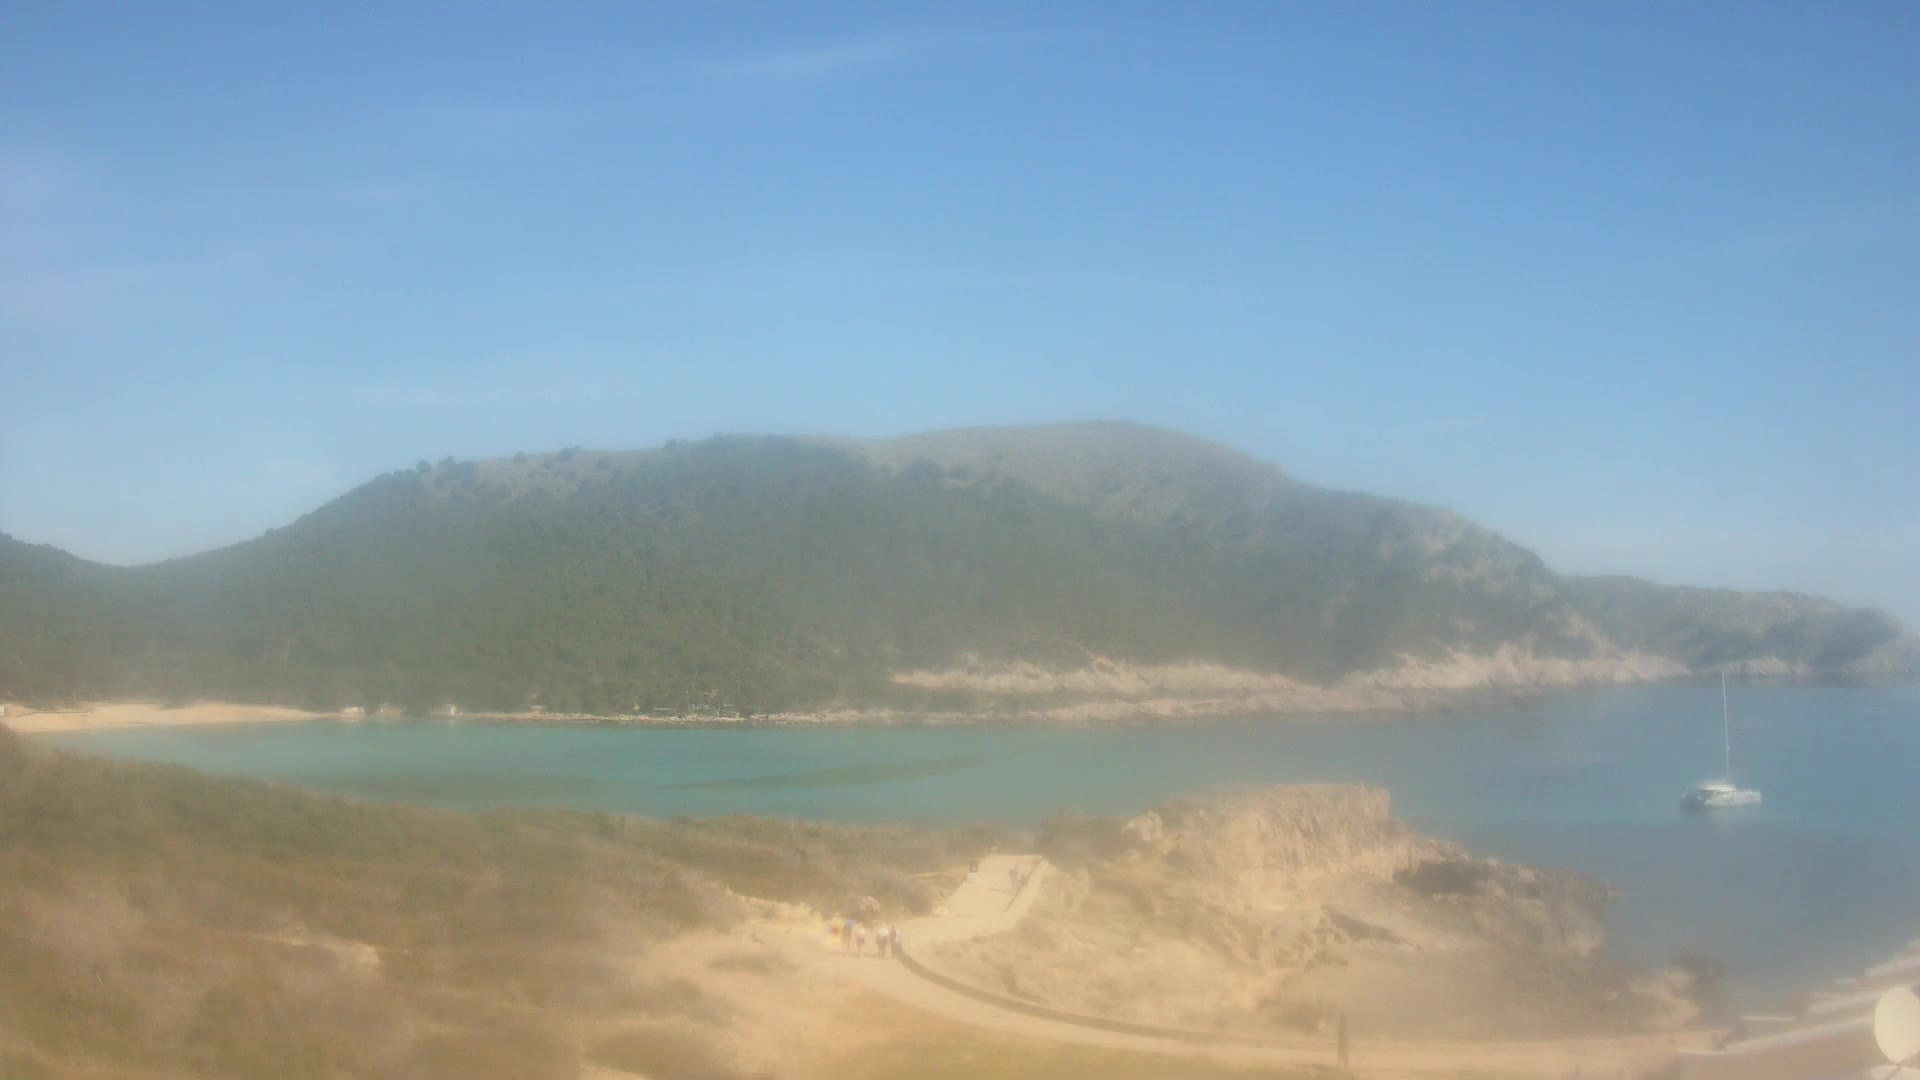
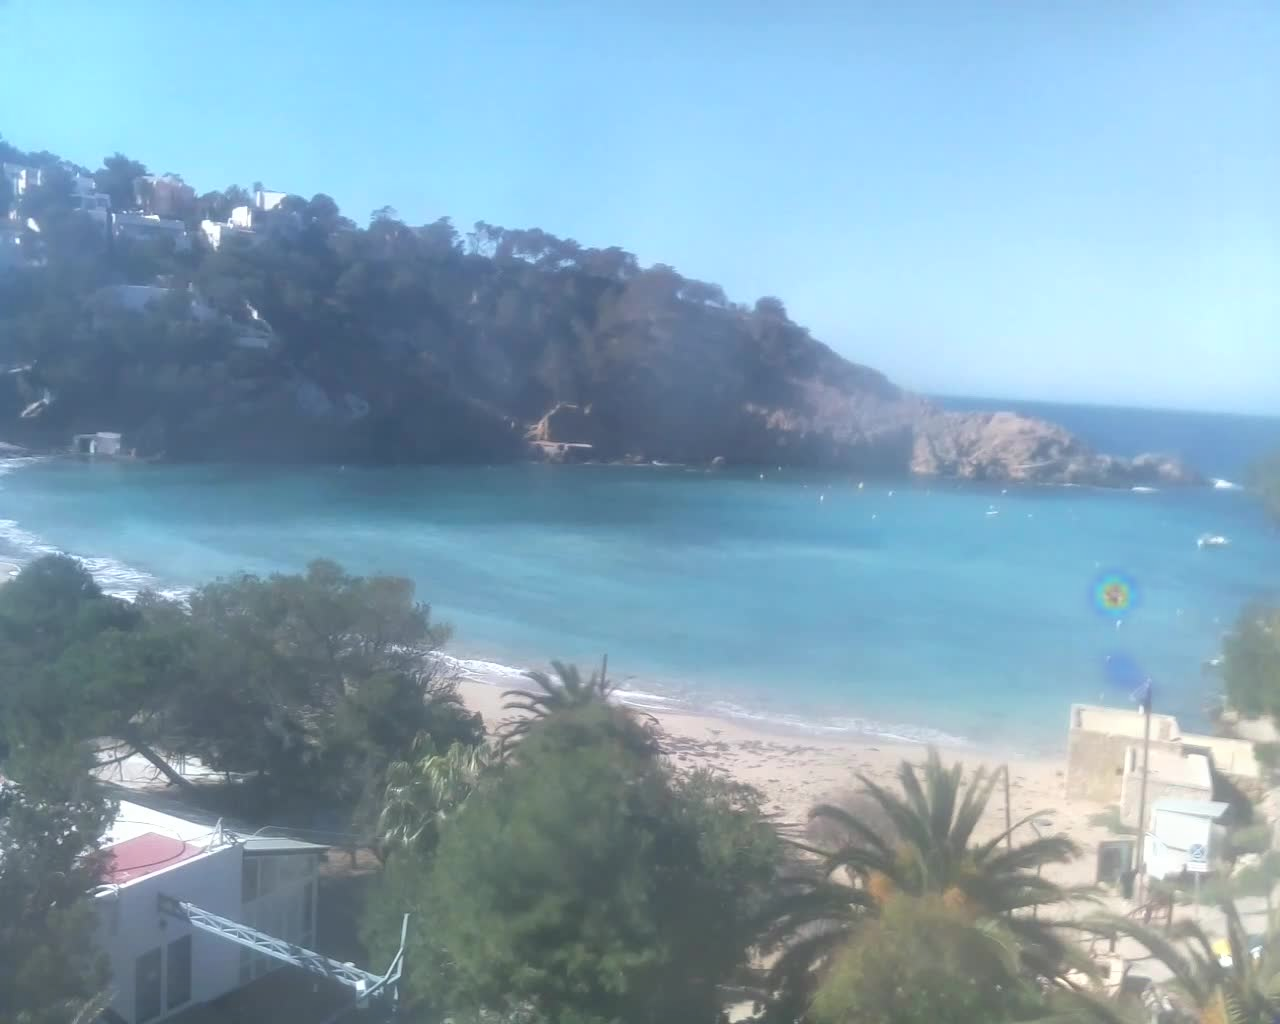
Estimación de la ocupación de otras playas de las Islas Baleares